Slide 5 of 5 from Tablet Chart Concept for PowerPoint with Blue Style
6035-02-tablet-chart-concept-blue-wide-5
Line Chart Design for Data Presentation
- Chart
- Line Chart
- Data Analysis Slide
- 16:9
- 100% Editable
The Line Chart Design slide from the Tablet Chart Concept for PowerPoint with Blue Style template offers a clear visualization tool for presenting performance metrics and trends over time. This slide layout is ideal for business presentations or pitch decks that require detailed analysis of sales data or app usage, utilizing editable slides and vector icons to enhance clarity and engagement.
What’s on This Slide
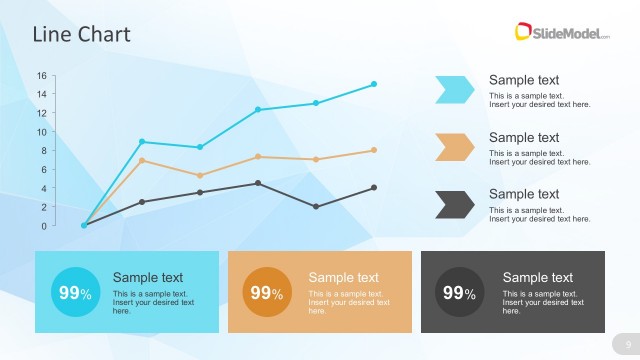
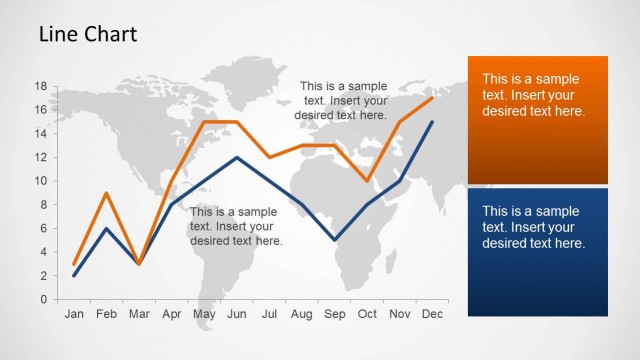
The layout features a line chart positioned centrally, displaying a series of data points connected by a blue line. The chart has a horizontal axis labeled with months and a vertical axis indicating values from 0 to 6. Above the chart, there is a title placeholder aligned to the left, with a subtitle placeholder directly beneath it. Below the chart, two text placeholders are present for additional information, centered and aligned to the bottom. The background is a light gradient, enhancing the visibility of the chart elements.
How to Use It
This layout serves as a data visualization tool, effectively presenting trends over time through a line chart. It fits well in a presentation sequence that discusses performance metrics or analytics, particularly in technology or business contexts. Ideal scenarios include showcasing monthly sales data, tracking app usage metrics, or illustrating performance trends. It can be used individually to highlight specific data points or trends in reports.
Text Placeholders & Capacity
Keep your copy within these limits so it fits without resizing. Body slots can hold roughly 15-20 words each.
| Placeholder | Count | Max characters (approx.) |
|---|---|---|
| Slide title | 1 | 30 |
| Subtitle | 1 | 50 |
| Body paragraph | 2 | 100 |
Slide Keywords
Download unlimited PowerPoint templates, charts and graphics for your presentations with our annual plan.
DOWNLOADReturn to Tablet Chart Concept for PowerPoint with Blue Style.