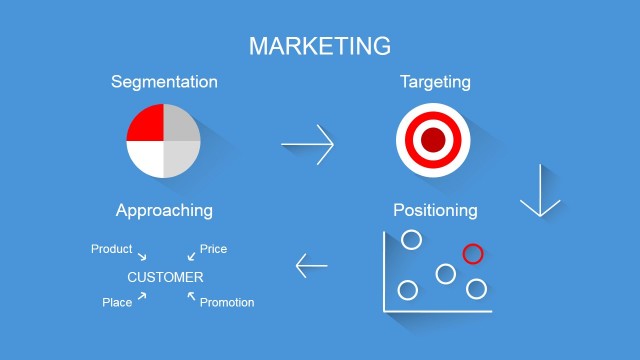
STP is an acronym familiar to those in the marketing profession, it stands for segmentation, targeting, positioning. STP Model is commonly used in marketing strategies to analyse projected performance based upon the known behavioural actions of customers in a market. The segmenting, targeting and positioning analysis is executed to know the customer and its buying process.
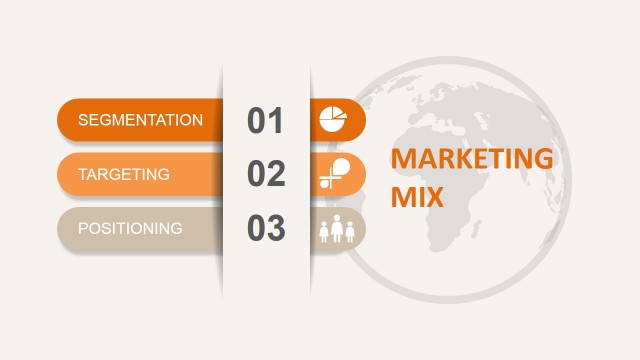
Segmentation, targeting and positioning maps are a crucial tool for marketers and many use them on a daily basis as a way of maximising their marketing impact. A well thought strategy that includes some element of STP can help to illustrate to CEOs and boards of directors the depth of your market knowledge. Using this type of model you can demonstrate a familiarity with your product and indicate who it is for (and in some instances, who it is not for). STP refers to:
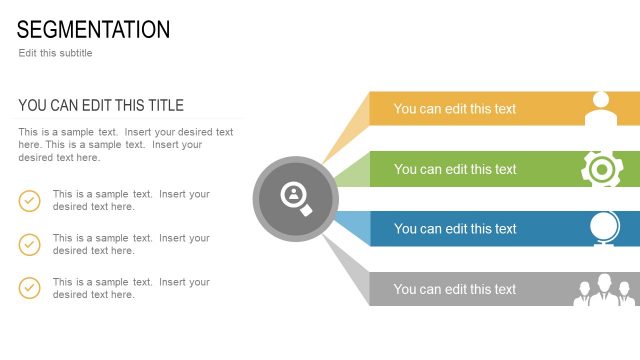
- Segmentation: this is where you get to know your customers. It is the process by which you understand the reasons that they purchase your products and goods
- Targeting: this is the act of you increasing your market relevance. It is the process by which you assess which of these people you can best satisfy with your products and services and how you can make yourself irresistible to them
- Positioning: this is the act of locating yourself appropriately. It is the process by which you arrange yourself for the market based upon your findings in the earlier stages. Consider the relative pros and cons of the market you intend to enter and question whether this market is aligned with your current goals – put simply, is the market worth your bothering?
This PowerPoint diagram model has been created with high quality clip art graphic vector the can be customized in any of their properties.
What’s inside this template
Example presentation scenarios
- A marketing manager can use the bubble matrix to brief executives on which customer segments combine stronger strategic fit with higher customer lifetime value.
- A product marketer can use the annotated slide to explain why selected target groups should receive priority in an STP positioning discussion.
- A consultant can use the focus-segment arrow and colored bubbles to guide a client workshop on segment attractiveness and investment choices.
- A brand strategist can use the three callout boxes to summarize recommendations for segmentation, targeting, and positioning after reviewing the matrix.
Features
- 100% editable presentation template
- Compatible with Microsoft PowerPoint and Google Slides
- 16:9 aspect ratio slides
- Scalable vector shapes, icons and illustrations
- AI-Ready for Microsoft Copilot and Claude
- Instant access and download
Frequently asked questions
Q: How should a presenter explain the STP message with this matrix?
A: Start by defining the two axes: customer lifetime value on the horizontal axis and fit with strategic direction on the vertical axis. Then explain what the colored bubbles represent before pointing to the Focus Segments arrow. Use the annotated slide to translate the matrix into recommendations, not just observations.
Q: Who is this template best suited for in a business presentation?
A: This template fits marketers, product marketers, brand strategists, and consultants who need to make segment prioritization clear for decision makers. It works best when the audience must compare several customer groups quickly and agree which segments deserve attention, resources, or further research.
Q: Why does the bubble matrix improve the segmentation discussion?
A: The matrix turns STP thinking into a spatial comparison. Segment bubbles can be read by position, color, and relative emphasis, while the diagonal guide and yellow focus arrow direct attention toward preferred opportunities. This reduces a long segmentation discussion to a visual choice about fit and value.


STP Model for PowerPoint
2-slide presentation template for STP segmentation, targeting, and positioning with market focus bubbles
STP Model for PowerPoint is a 2-slide diagram template for explaining segmentation, targeting, and positioning. The slides show a strategic segmentation bubble matrix, customer lifetime value and strategic fit axes, a focus-segment arrow, and color-coded callout boxes. It is designed for marketers and strategy teams using Microsoft PowerPoint or Google Slides.
- Category
- Diagrams
- Rating


 Loading...
- Aspect ratio
- 16:9, 4:3
- Item ID
- 6569-02
- Colors
 Microsoft PowerPoint
 Microsoft Copilot
 Claude for PowerPoint
Other formats supported
Subscribe today and get immediate
access to download our PowerPoint templates.