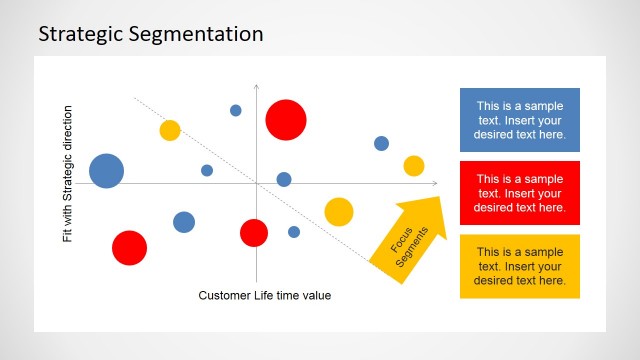
Life Time Value Strategic Segmentation Chart
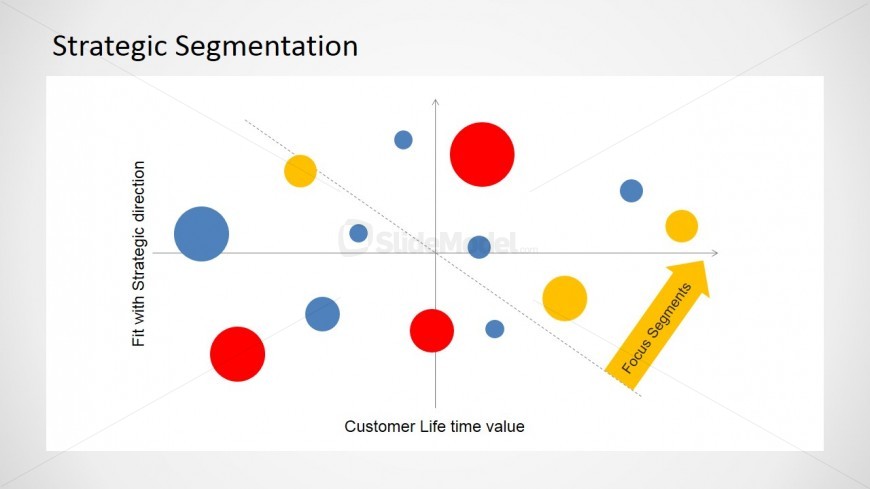
This slide focuses on a chart that displays a marketing mix for a business strategy. A cartesian x, y chart takes up the central section of the slide and serves as a background reference point for a series of differently colored circles which are laid out seemingly through the graph. These circles make reference to products and services offered by a generic company in analysis of their life time value – a typical trait of an STP map. You might use the three separate colors here to denote the three key areas of STP: segmentation, targeting and positioning.
Return to STP Model for PowerPoint.