Hand Drawn Bar Chart PowerPoint Template
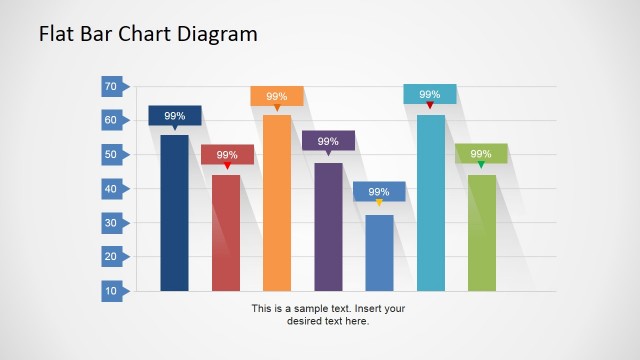
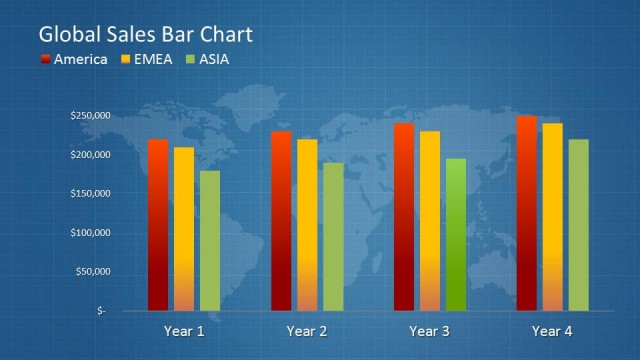
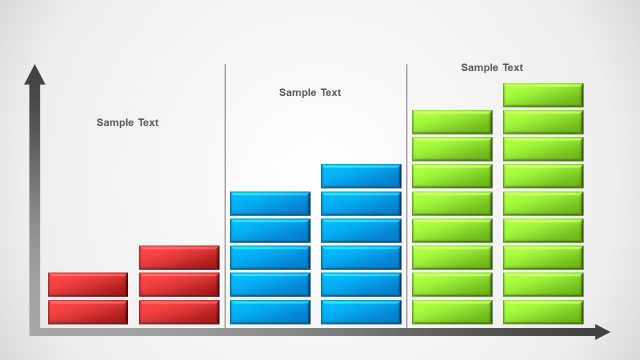
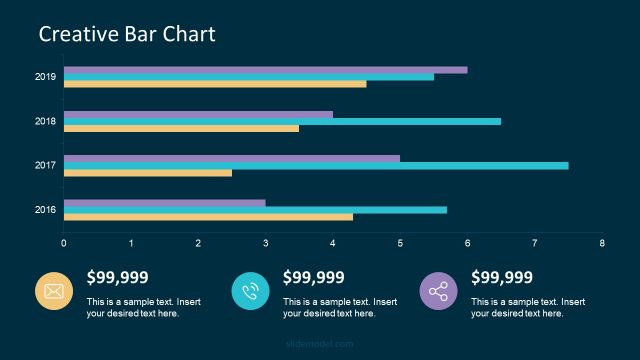
The Hand Drawn Bar Chart PowerPoint Template is a presentation template design containing an appealing bar chart illustration. It is presented in a hand-drawn style created as PowerPoint shapes. Create a creative business presentation using the graphics, making use of the charts to show important statistical information.
With the blue background and white graphics, the template replicates a blueprint style. This specific design can be used by the presenter as a metaphor, showing the different bar charts as foundations for future business. This is especially true when the charts are used to show forecast information and financial statistics.
Different variations of bar charts can be found in the Office template. This allows the presenter to choose the most suitable slide for his or her purposes. This also makes the presentation more flexible, and more reliable.
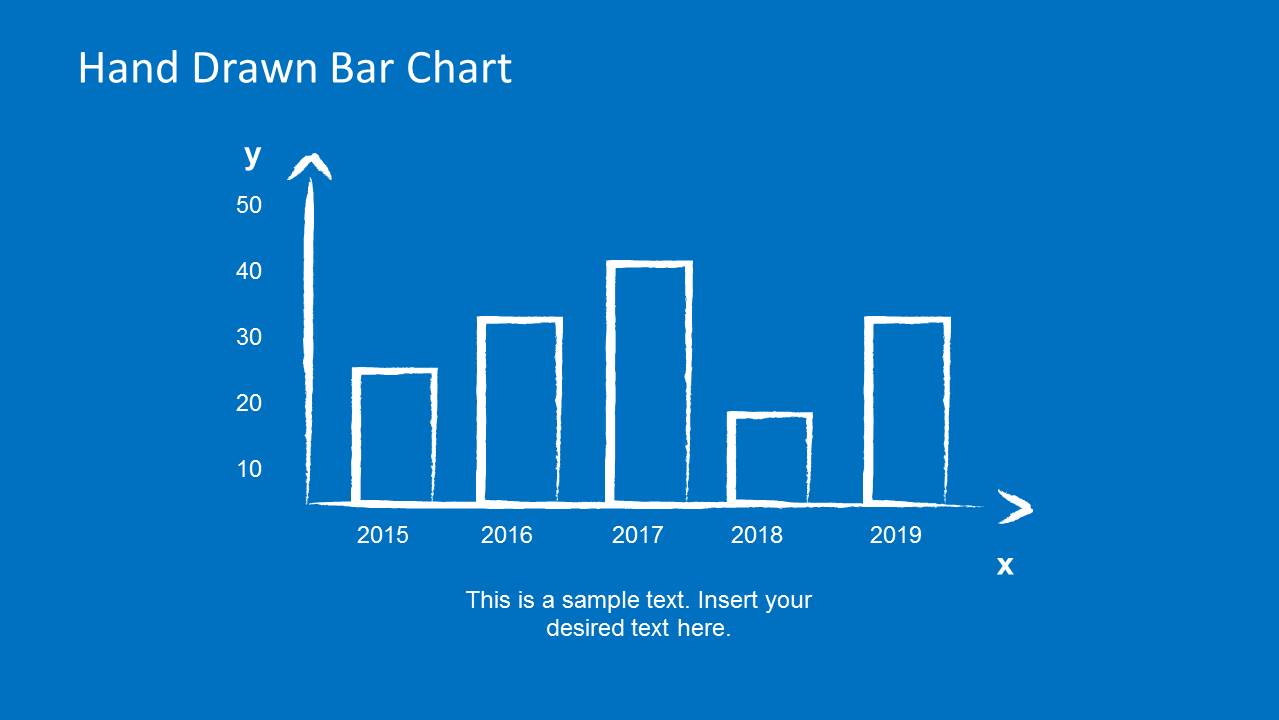
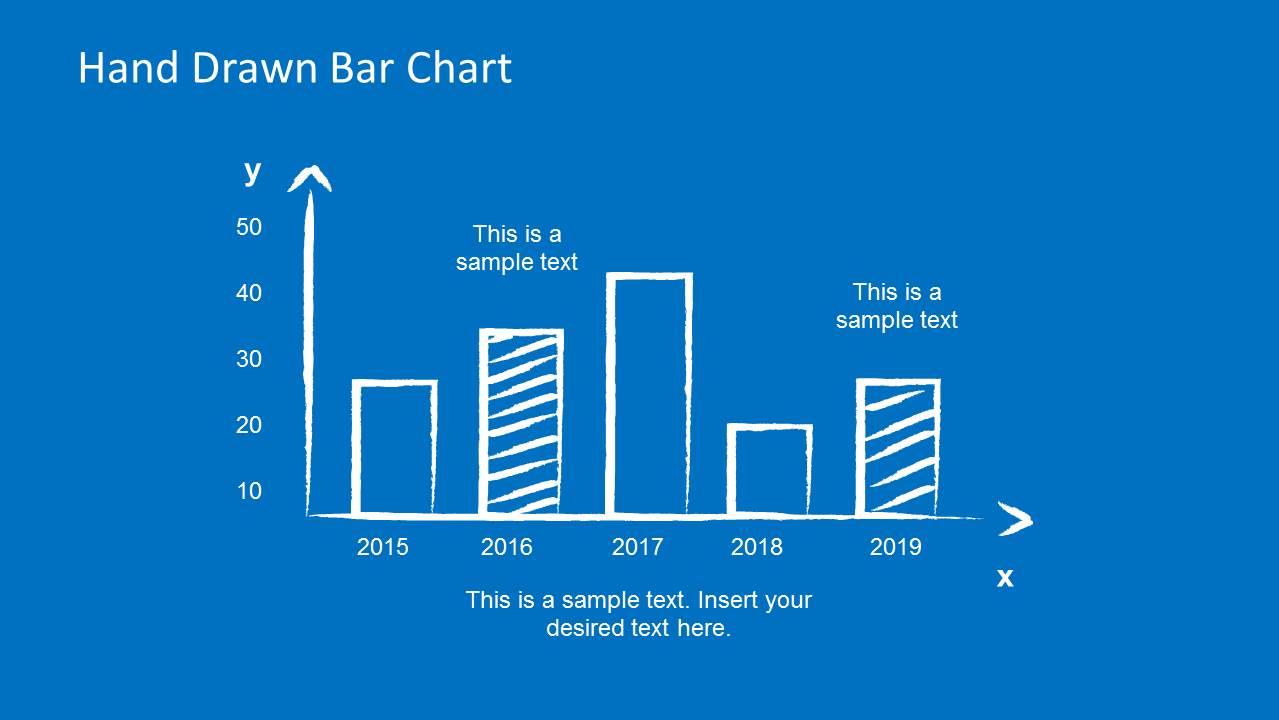
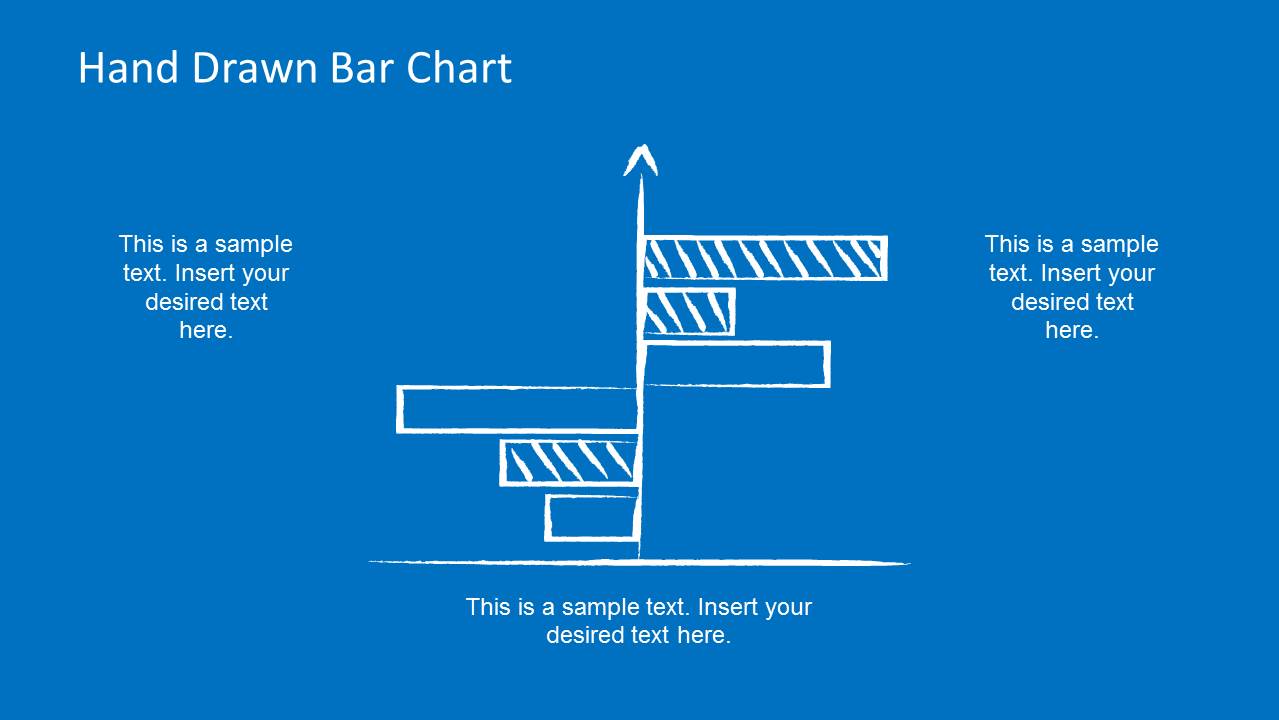
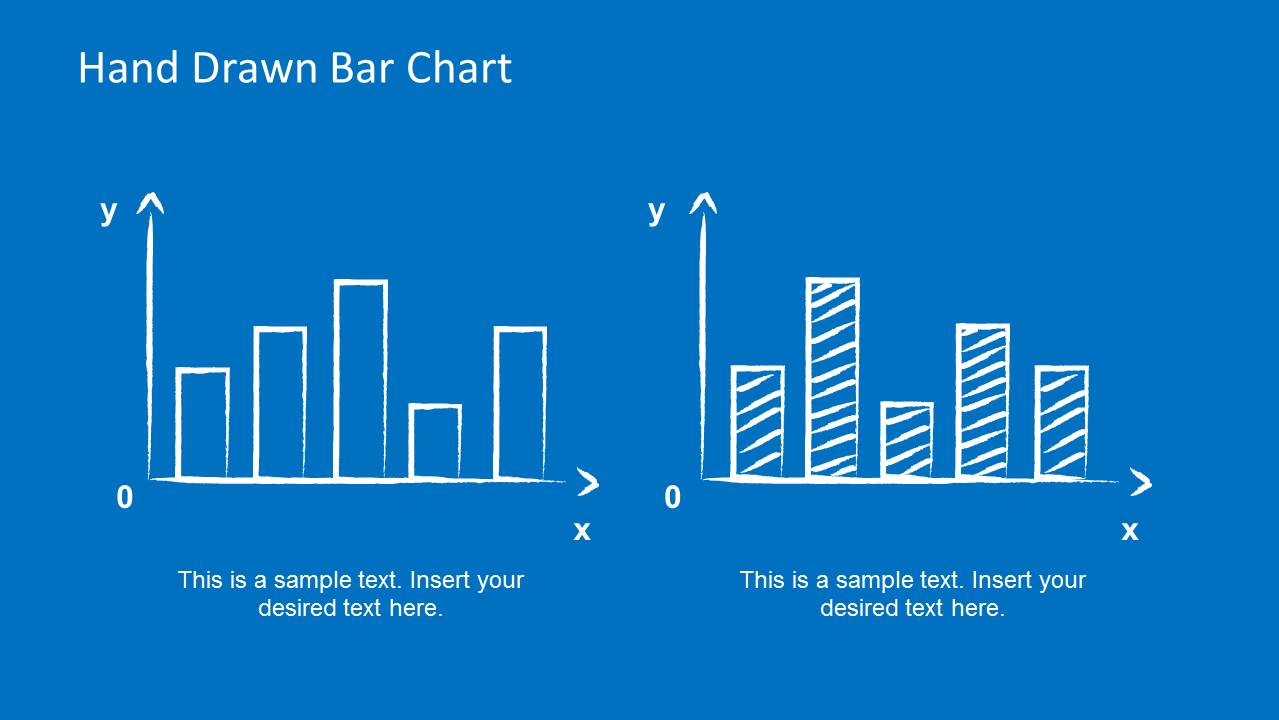
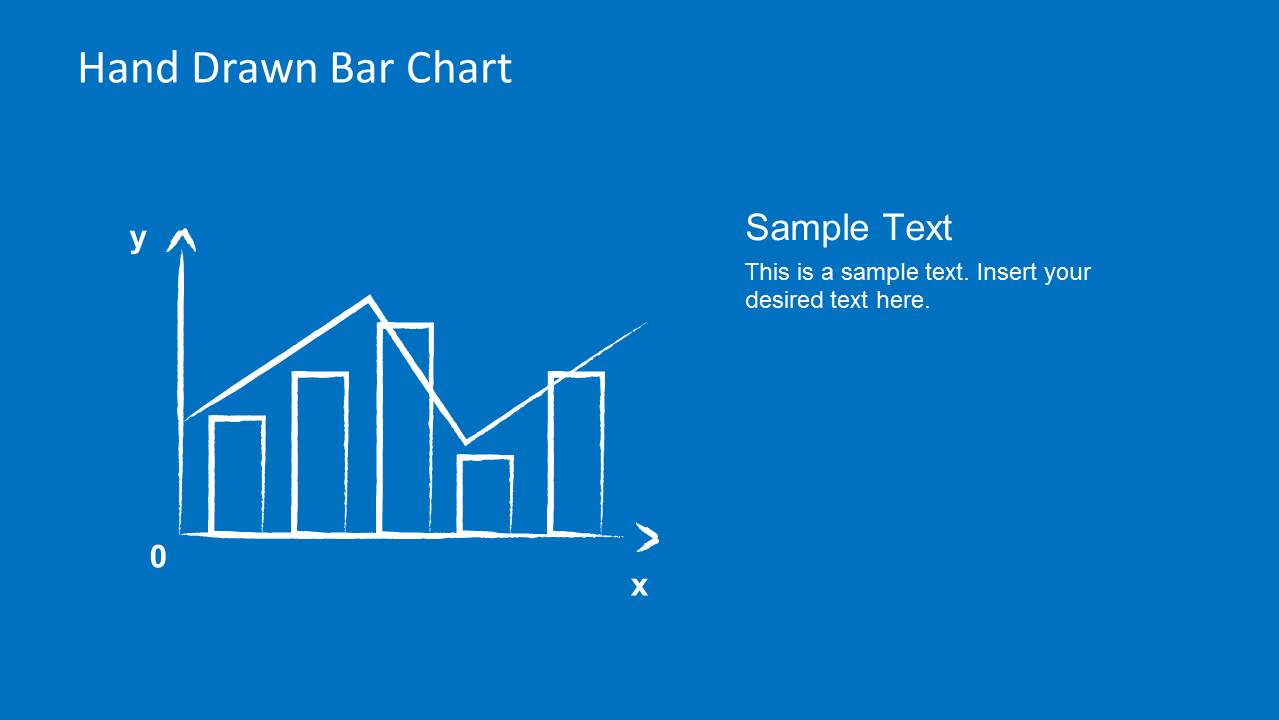
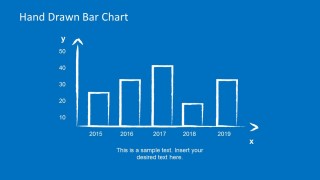
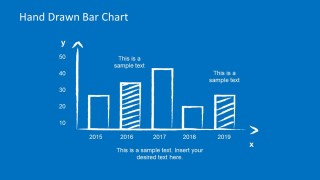
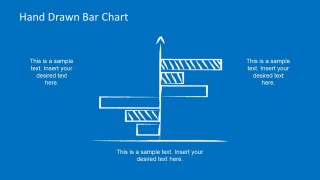
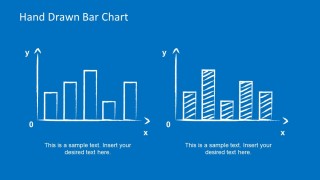
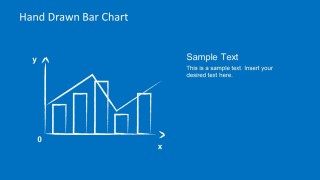
It starts with a simple bar chart, with plain-looking bars in the same blueprint style. It then includes another slide design of the same kind, with the exception of an alternating pattern between the bars for easy distinction. The template also includes a horizontal bar chart that goes in both directions. This can be used to show profit or loss data, with the center line representing breakeven. Another slide puts two vertical bar charts side by side for comparison, with one having plain bars, and the other having shaded ones. The template also has a simple bar chart which has a trend line. This can be utilized in trend analysis to show forecast data, and allow management to make well-informed business decisions.
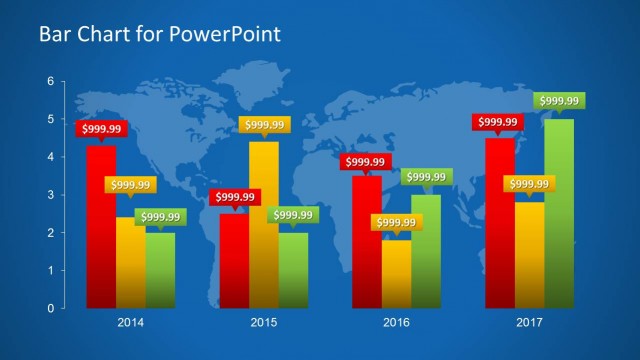
The presenter can also download other PowerPoint templates from the Gallery, like the Bar Chart Template for PowerPoint.
Most suitable for financial data analysis, the Hand Drawn Bar Chart PowerPoint Template gives an easy, relaxing background to the otherwise serious hard data. This removes tension from both the audience and the presenter, allowing maximum cooperation between the two.
