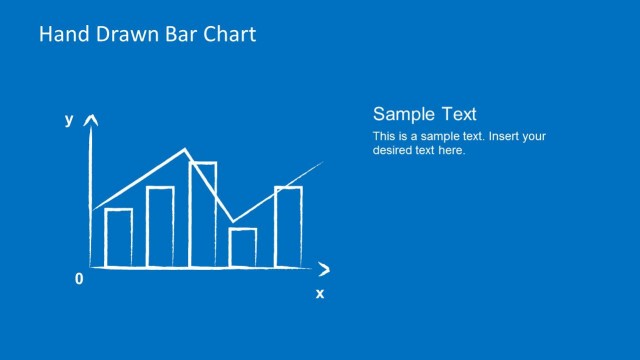
Hand Drawn Bar Chart Slide
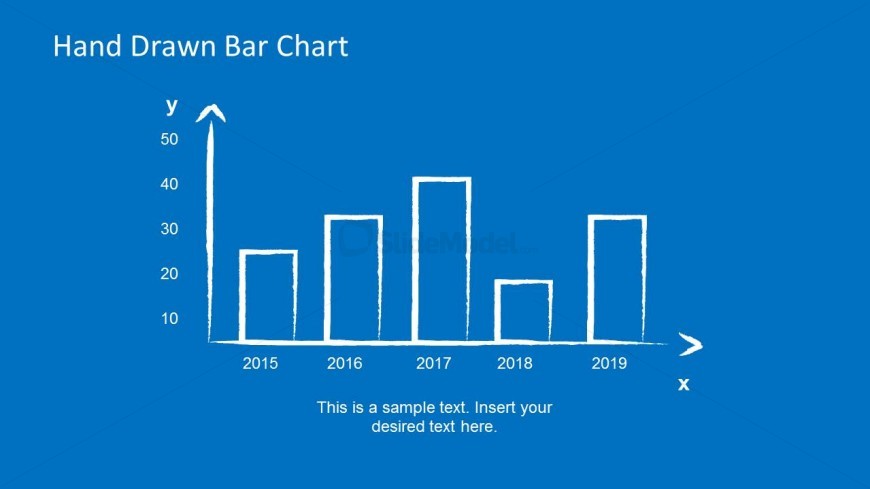
The PowerPoint slide can be used to present a Hand Drawn Bar Chart Slide. The PowerPoint graphics are made to resemble a chalk or pen illustration, as seen on a blueprint. The blueprint theme is completed by the blue presentation background. The chart’s x-axis is labeled in years, while the y-axis contains values in multiples of 10. A text placeholder has been provided at the bottom of the slide.
Ideal for presentations on construction and factory production, the bar chart can reflect statistical information on sales and materials consumption. These can include trends throughout five years, so that the management can track specific patterns that emerge from the data analysis. Any alteration regarding the color and size will not affect the graphic resolution of the PowerPoint icons.
Return to Hand Drawn Bar Chart PowerPoint Template.