Comparison Hand Drawn Bar Chart for PowerPoint
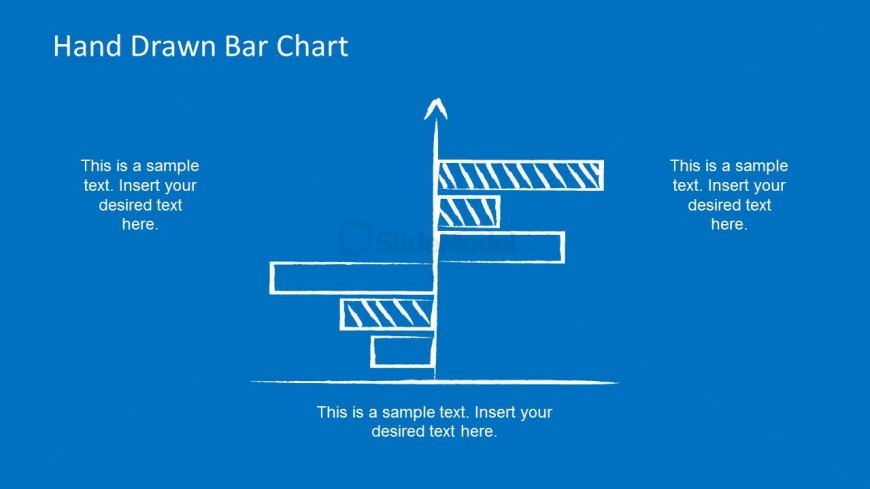
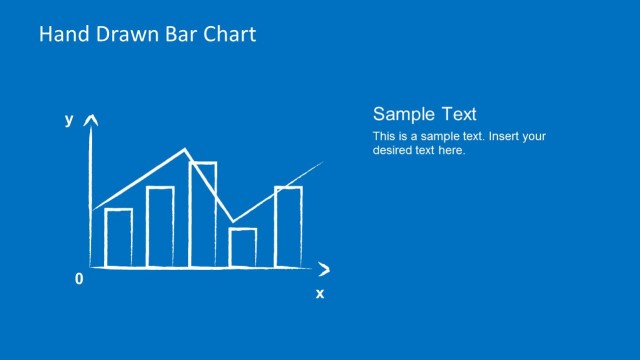
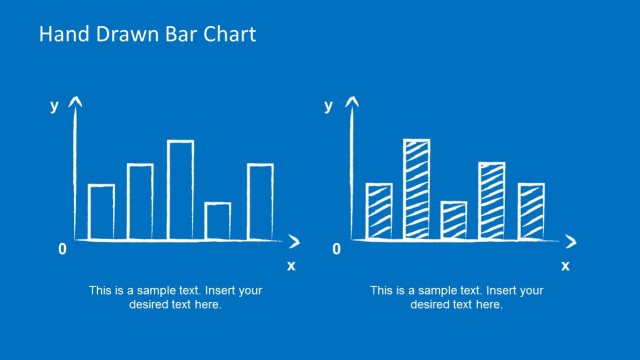
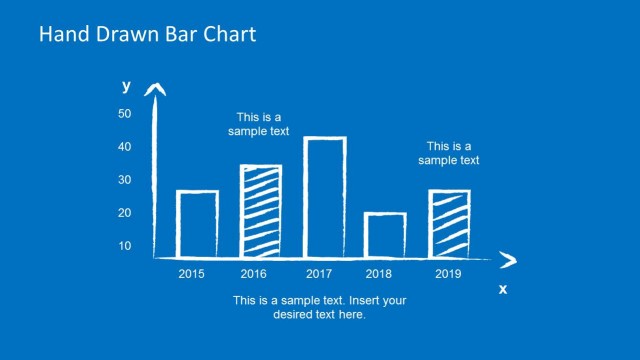
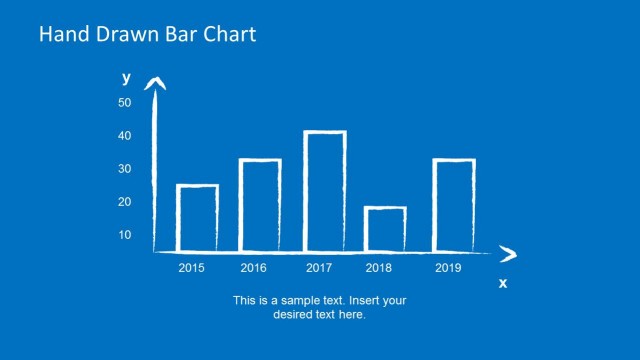
The slide design contains a Comparison Hand Drawn bar Chart for PowerPoint. It uses a blueprint theme that features chalk-based PowerPoint graphics. These are shown against a blue presentation background to complete the effect. Three text placeholders have been provided on the slide to allow the presenter to insert descriptions.
The presenter can use the PowerPoint slides for presenting statistics concerning construction and production. The discussion can include a running tally of materials that are purchased and consumer during the course of operation. The PowerPoint objects can be rearranged to suit the presenter’s specifications. Any modifications, event to size, will not affect its graphic resolution.
Return to Hand Drawn Bar Chart PowerPoint Template.