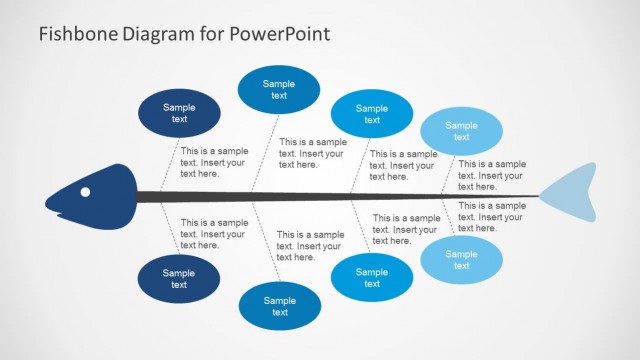
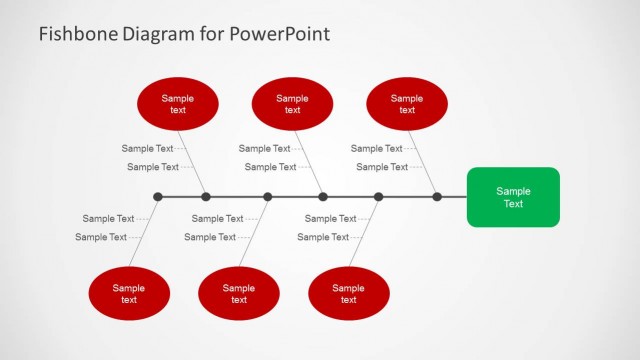
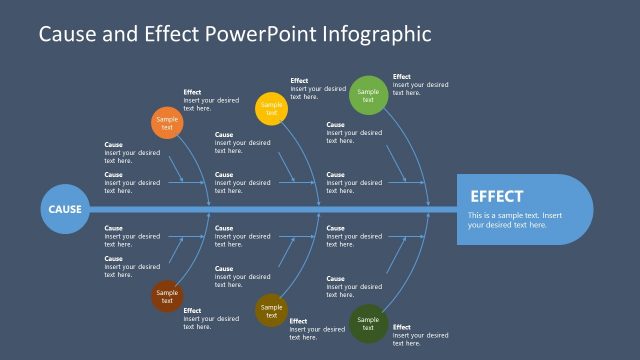
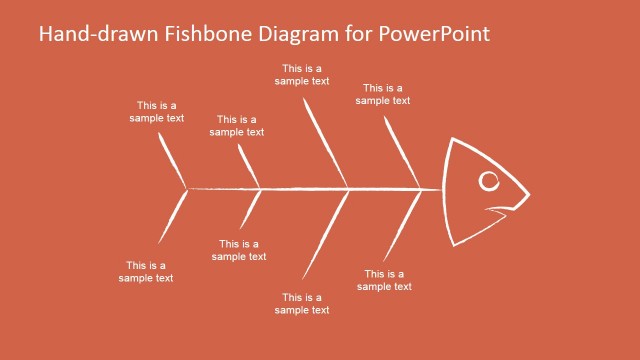
Create cause and effect diagrams using a variety of creative layouts with the Green Cause & Effect Diagram for PowerPoint.
With editable diagrams, this template is perfect for making cause and effect illustrations. Basic cause and effect diagrams can be generated in no time by simply adding text to the given diagrams.
You can customize and adjust the sample diagrams according to need and also add your own content to further enhance your slides.
What’s inside this template
Example presentation scenarios
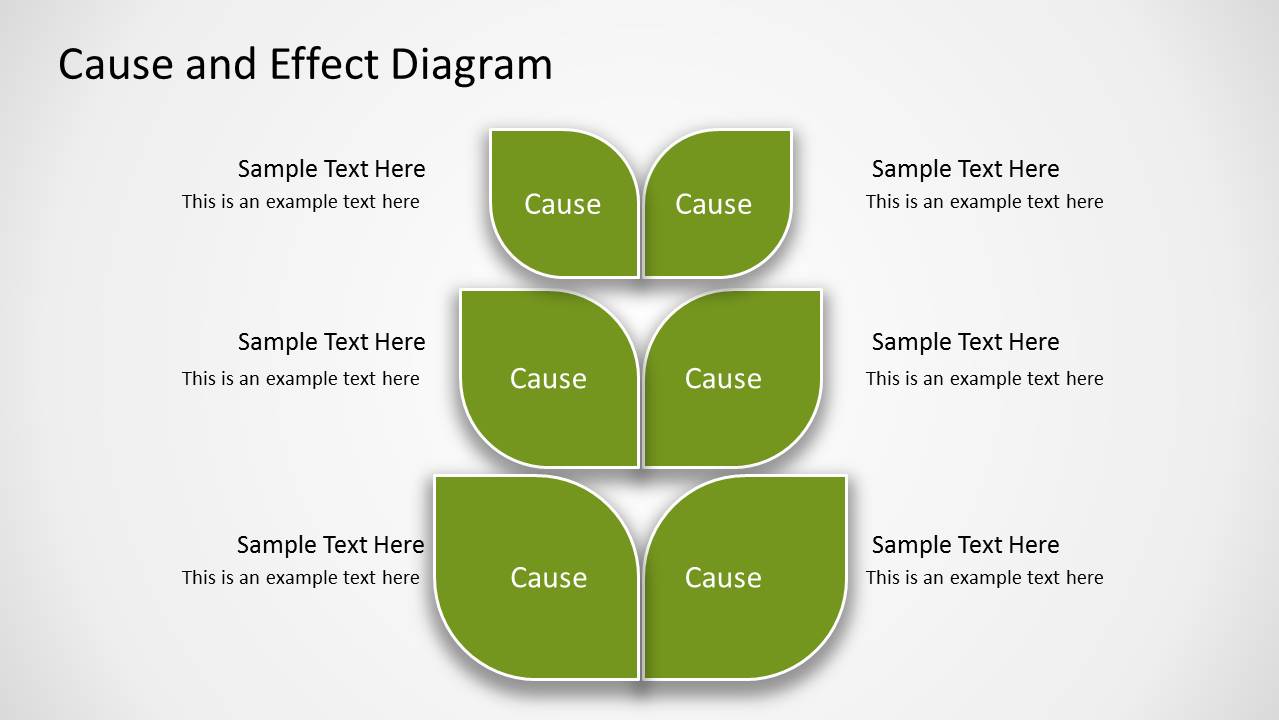
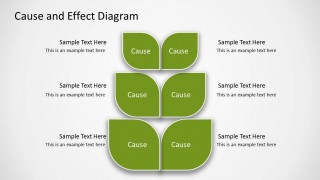
- A quality manager can use the stacked leaf cause diagram to group recurring operational issues and explain how each category contributes to the main problem.
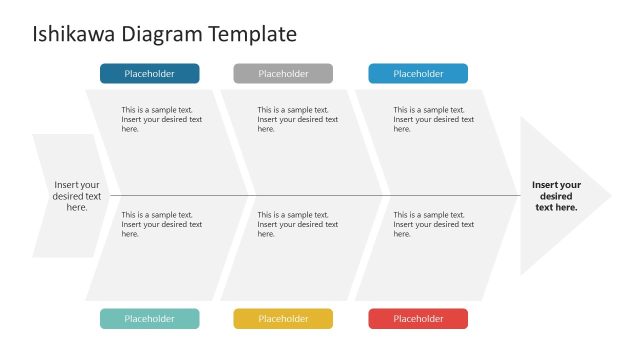
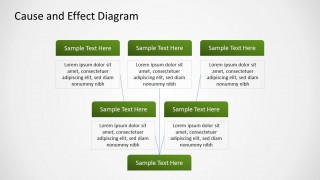
- A business analyst can use the converging cause boxes to summarize workshop findings and show how separate observations lead to one final effect.
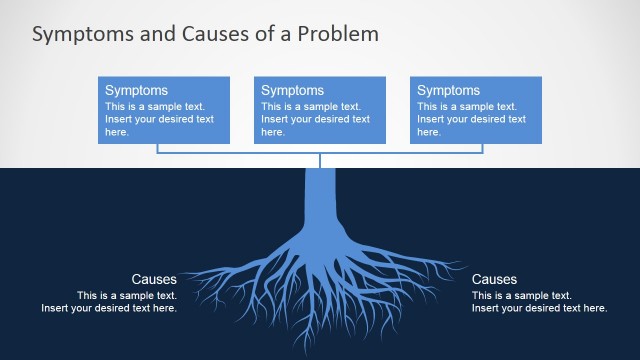
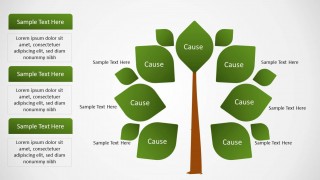
- A consultant can use the tree metaphor diagram to make a root cause discussion more visual for executives while keeping supporting notes in the side text cards.
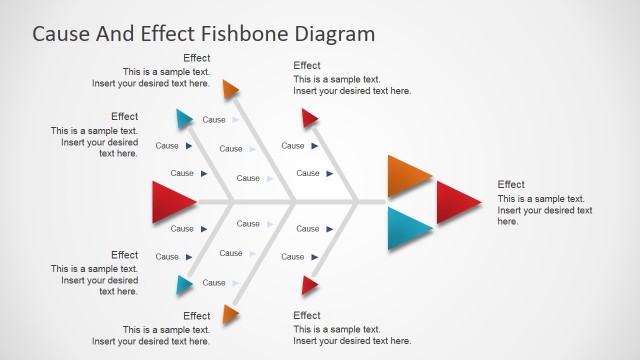
- A project manager can use the left-to-right flow diagram to show how several inputs create intermediate conditions before producing a final project risk or outcome.
Features
- 100% editable presentation template
- Compatible with Microsoft PowerPoint and Google Slides
- Scalable vector shapes, icons and illustrations
- AI-Ready for Microsoft Copilot and Claude
- Instant access and download
Frequently asked questions
Q: How should a presenter organize the message with this cause and effect template?
A: Start with the simplest view of the issue before adding detail. Use the stacked leaf diagram to name the main cause categories, then move to the converging box or flow layout when showing relationships. Keep each shape to one short phrase so the audience can follow the logic without reading long paragraphs.
Q: Who is this template best suited for in a business presentation?
A: This template fits analysts, consultants, operations leaders, and project managers who need to explain why a problem is happening. It works well in root cause reviews, process improvement meetings, and management updates because the layouts show causes as grouped, connected, or sequential rather than as isolated bullet points.
Q: Why use leaves and a tree metaphor for cause and effect analysis?
A: The organic leaf and tree visuals make causal relationships easier to scan because each cause appears as a distinct element connected to a larger system. The metaphor supports root cause thinking: visible outcomes grow from underlying contributors. This can make an abstract analysis feel more structured and less like a list of complaints.



Green Cause & Effect Diagram for PowerPoint
4-slide PowerPoint diagram template for root cause analysis, leaf diagrams, and cause-effect mapping
Green Cause & Effect Diagram for PowerPoint is a 4-slide diagram template for root cause analysis and process explanation. It includes a stacked leaf cause diagram, converging cause boxes, a tree metaphor diagram, and a left-to-right cause-effect flow. It is designed for PowerPoint presentations.


 Loading...
 Microsoft PowerPoint
  Microsoft Copilot
  Claude for PowerPoint
 Other formats supported
Subscribe today and get immediate
access to download our PowerPoint templates.