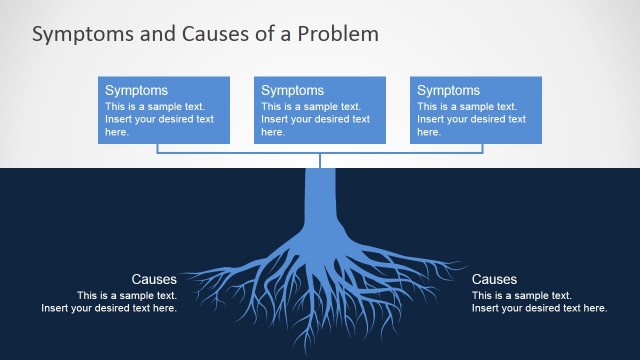
Cause & Effect PowerPoint Template is a presentation design template that you can use to support your Cause & Effect Analysis slides during a Microsoft PowerPoint presentation. It contains several slide designs with cause & effect analogies in PowerPoint that were created as PowerPoint graphics so you can easily customize the appearance and change the shape properties to fit your presentation or corporate visual identity.
What’s inside this template
Example presentation scenarios
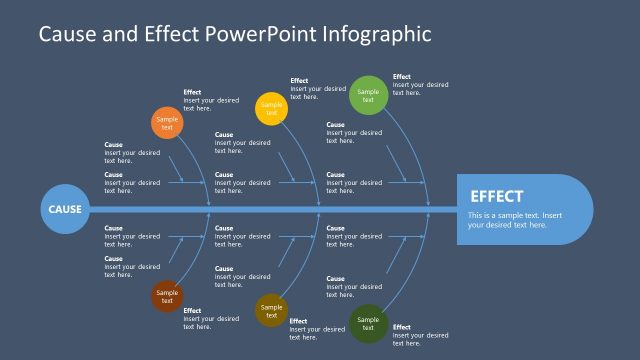
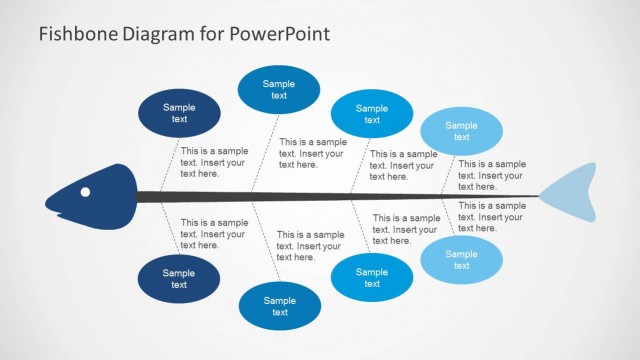
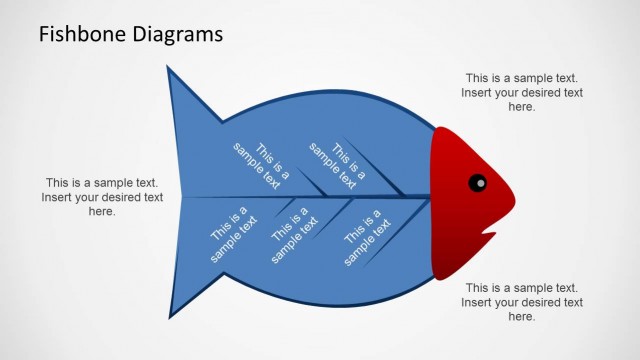
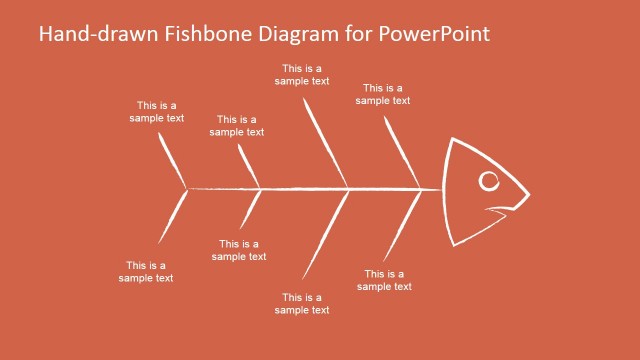
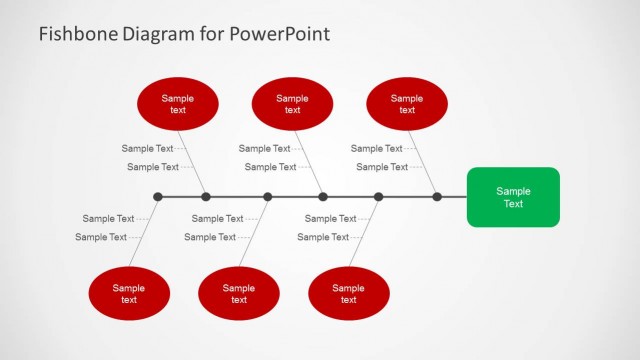
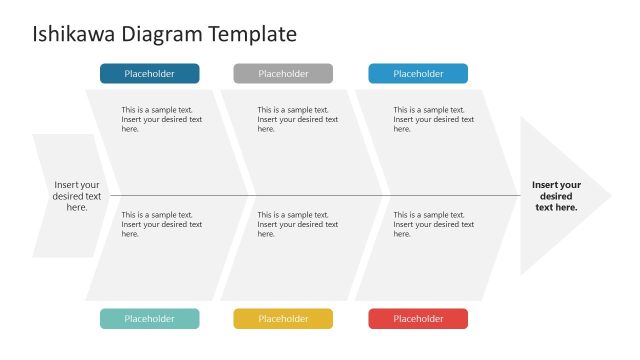
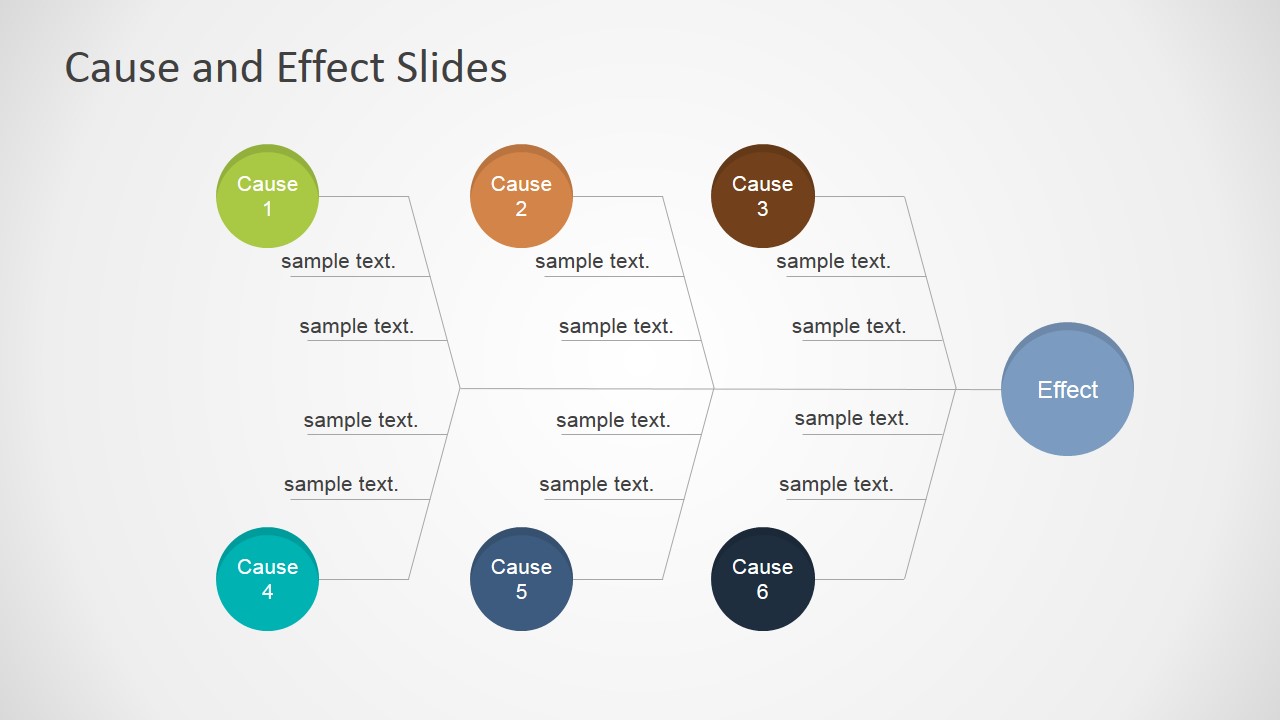
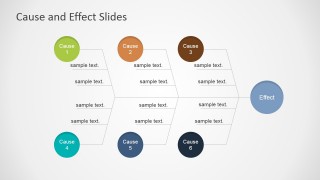
- A quality manager can use the six-cause fishbone diagram to guide a team discussion on why a defect, delay, or service failure occurred.
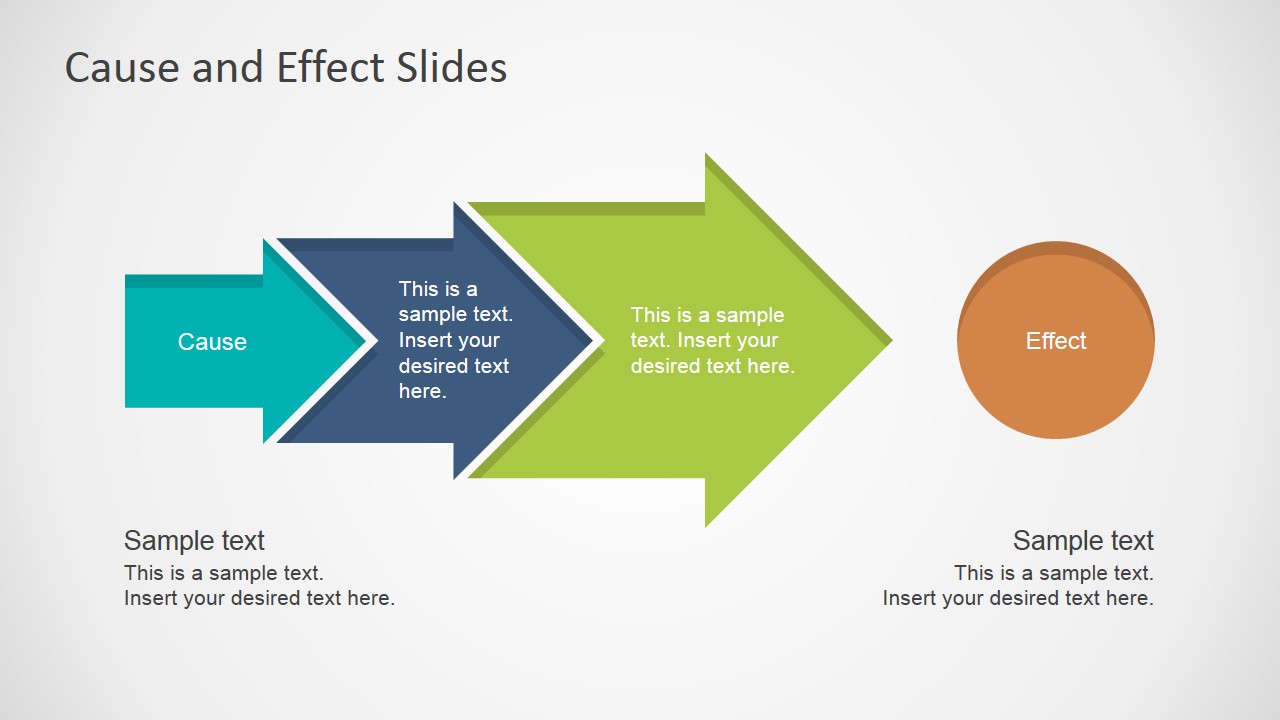
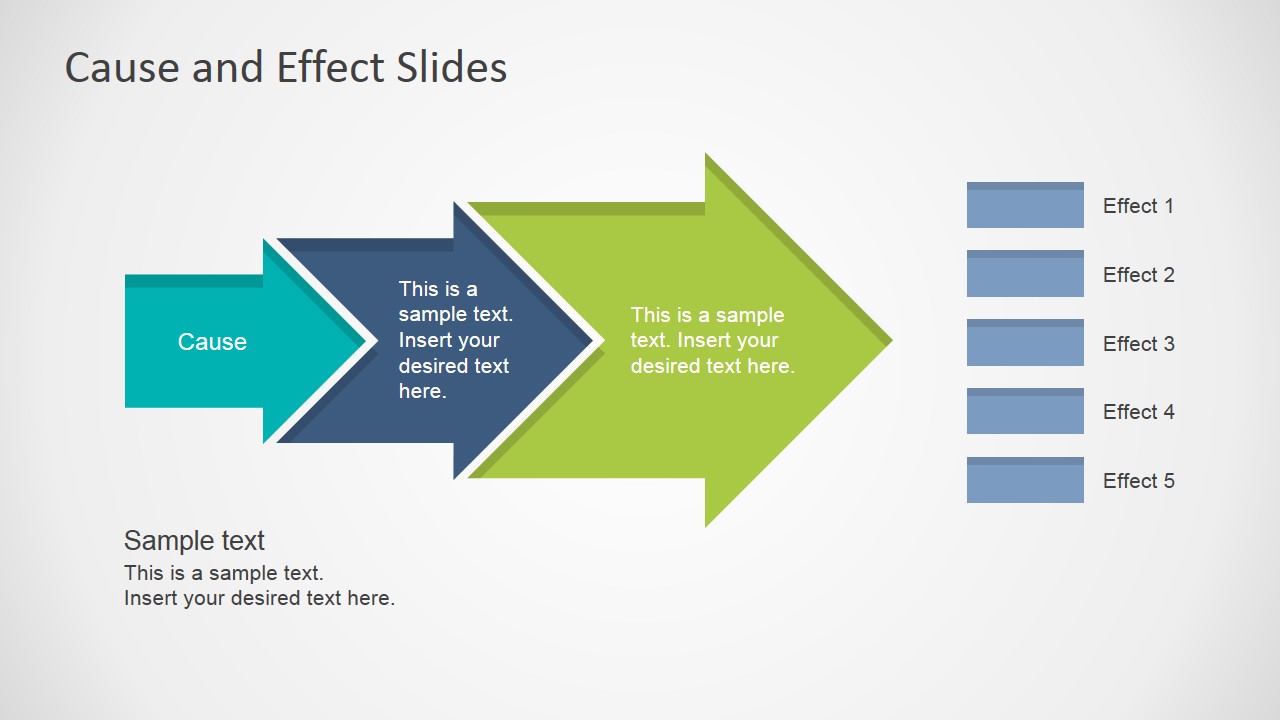
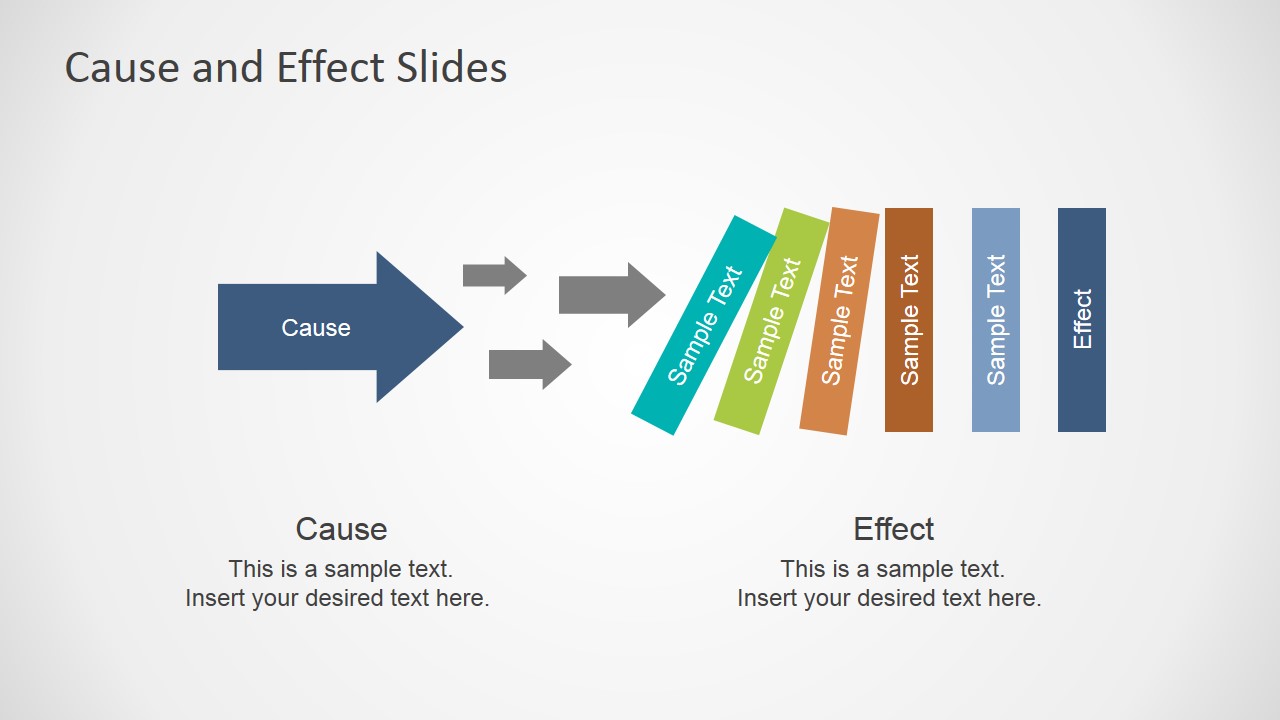
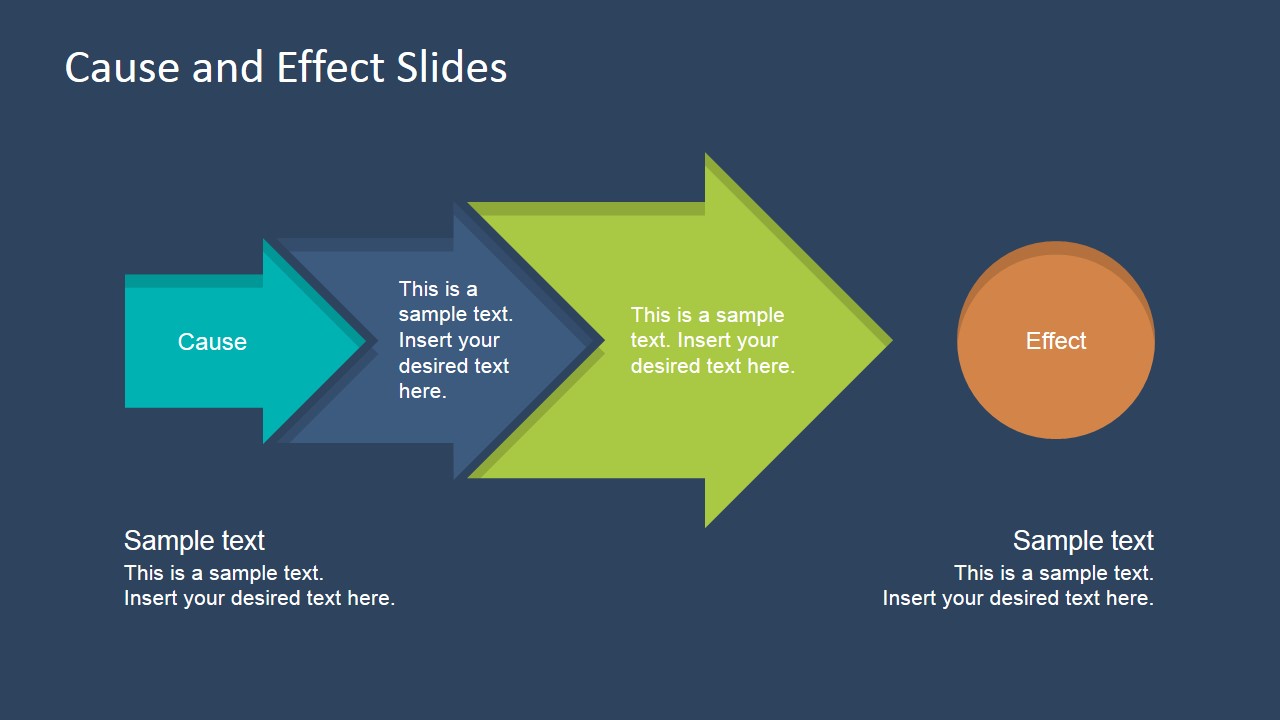
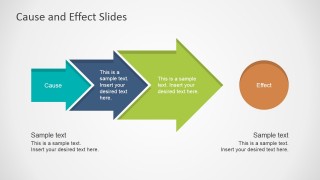
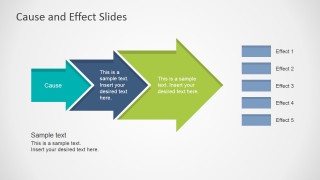
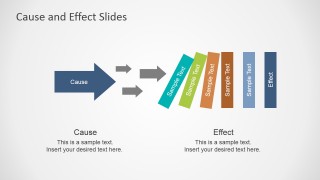
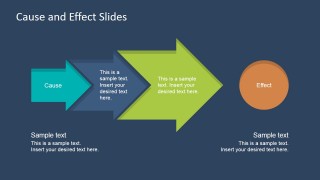
- A business analyst can use the arrow flow slides to show how an initial cause moves through process factors before producing a measurable effect.
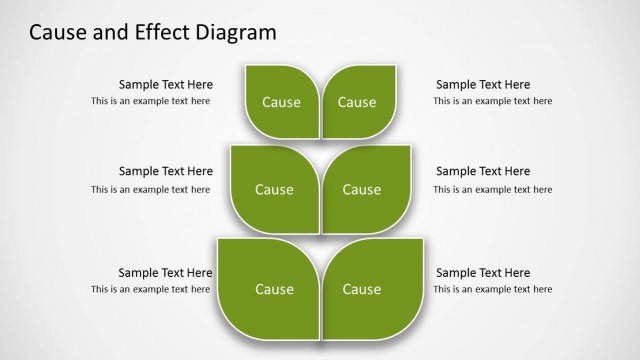
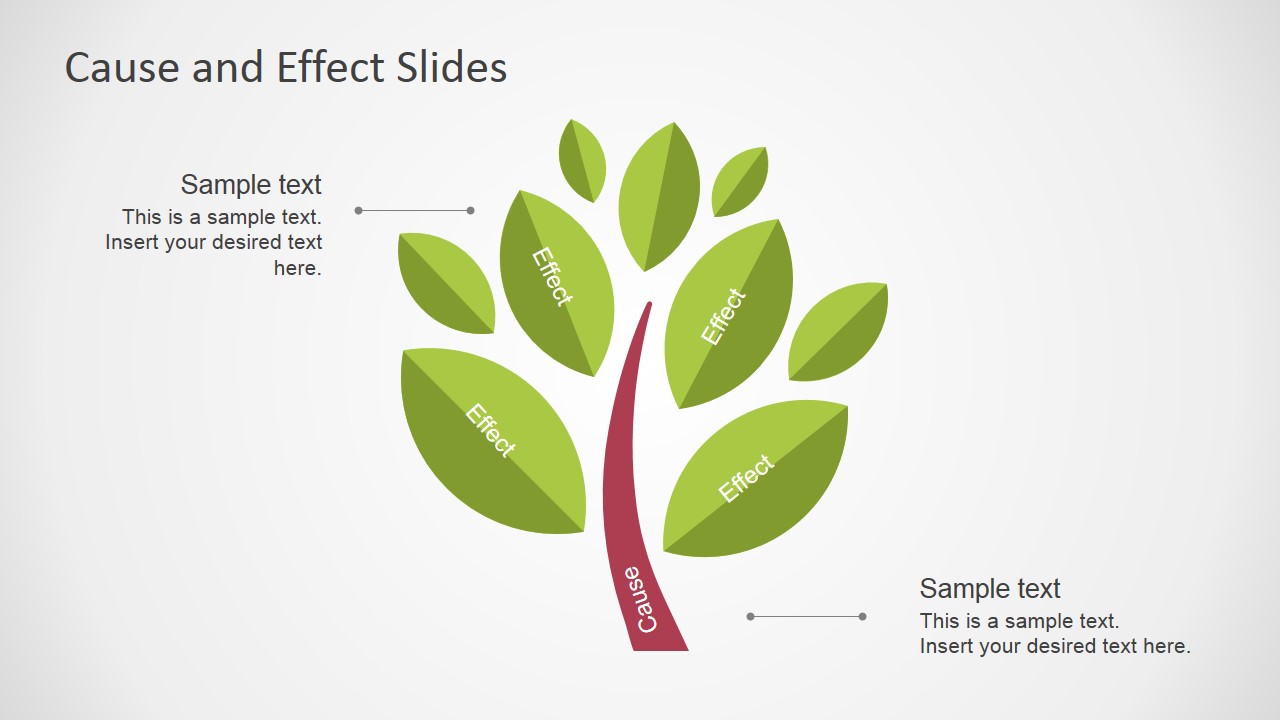
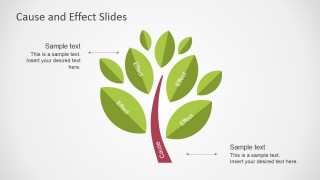
- An operations leader can use the tree metaphor slide to separate one root cause from several visible effects during a process improvement meeting.
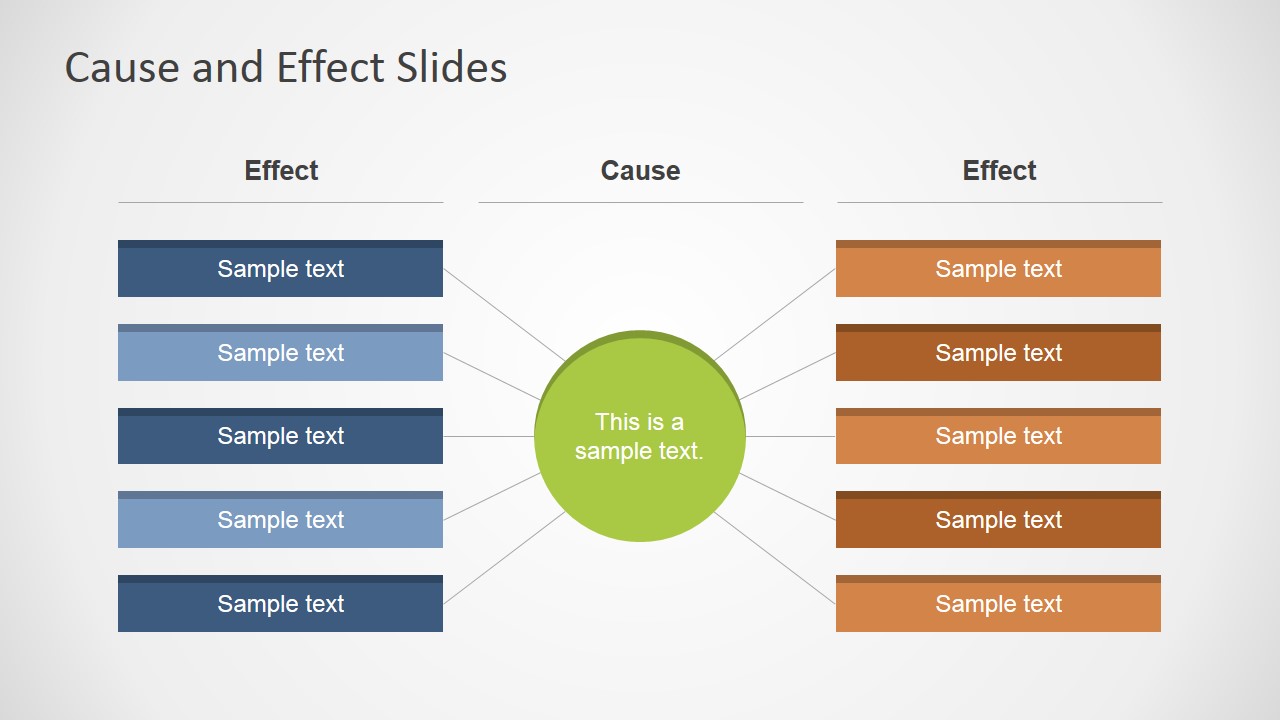
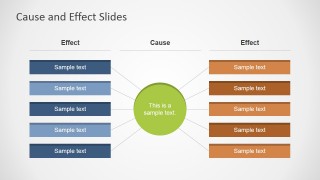
- A consultant can use the hub-and-spoke comparison slide to compare effects on both sides of a central cause statement for an executive audience.
Features
- 100% editable presentation template
- Compatible with Microsoft PowerPoint and Google Slides
- 16:9 aspect ratio slides
- Scalable vector shapes, icons and illustrations
- AI-Ready for Microsoft Copilot and Claude
- Instant access and download
Frequently asked questions
Q: How should a presenter build a clear root cause story with this template?
A: Start with the cover to name the issue, then use an arrow flow slide to show the basic cause-to-effect chain. Move to the fishbone diagram when the discussion needs categories or contributing factors. Finish with the comparison hub if stakeholders need to see how one central problem creates different effects across teams, customers, or processes.
Q: Who is this template best suited for in a business setting?
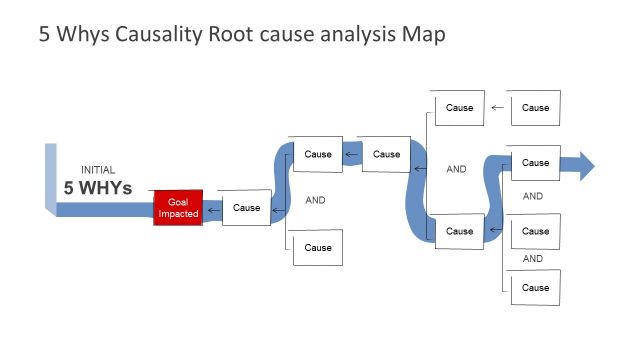
A: It fits presenters who need to explain why something happened rather than only report that it happened. Quality managers, operations leaders, consultants, and business analysts can use the tree, fishbone, and arrow layouts to organize workshop findings, incident reviews, 5 Why's results, or process troubleshooting discussions for decision makers.
Q: Why do the arrow, tree, and fishbone metaphors help explain cause and effect?
A: Each metaphor reduces a different communication problem. Arrows show direction and sequence, the tree separates a root from visible outcomes, and the fishbone structure groups contributing causes without turning the slide into a long paragraph. These visuals help an audience see relationships before debating details.


Cause & Effect PowerPoint Template
8-slide presentation template for cause and effect analysis, fishbone-style root cause diagrams, and process arrows
The Cause & Effect PowerPoint Template is an 8-slide diagram set for root cause analysis in Microsoft PowerPoint and Google Slides. It includes a cover, directional arrow flows, a tree metaphor, a six-cause fishbone diagram, a hub-and-spoke cause/effect comparison, and editable vector shapes for business analysts, quality teams, and managers.
- Category
- Business PowerPoint Templates
- Rating


 Loading...
- Aspect ratio
- 16:9
- Item ID
- 6946-01
- Colors
 Microsoft PowerPoint
  Microsoft Copilot
  Claude for PowerPoint
 Other formats supported
Subscribe today and get immediate
access to download our PowerPoint templates.