Slide 4 of 4 from Green Cause & Effect Diagram for PowerPoint
9036-cause-and-effect-diagram-wide-4
Cause and Effect Diagram for Presentations
- Diagram
- Cause Effect
- Strategic Analysis Slide
- 16:9
- 100% Editable
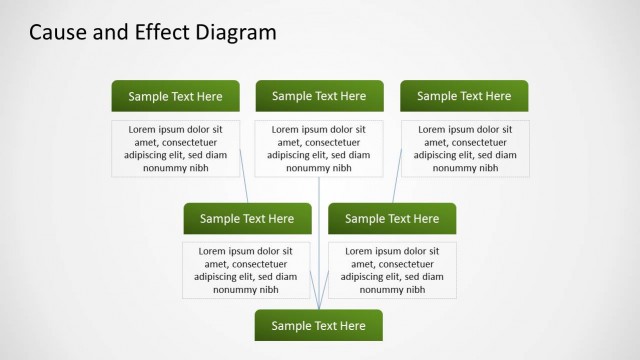
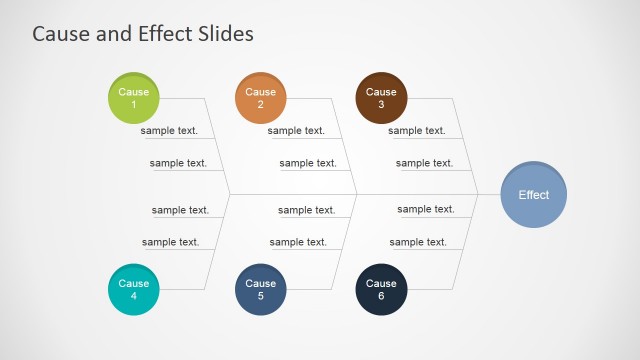
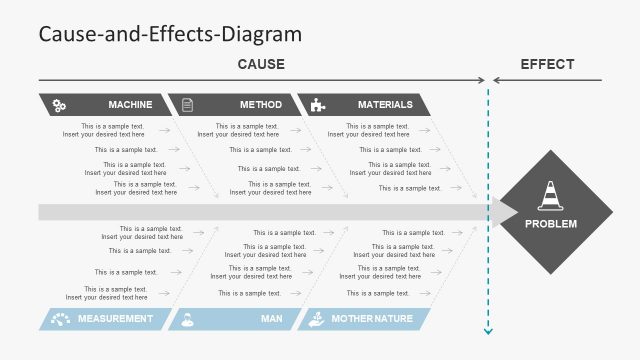
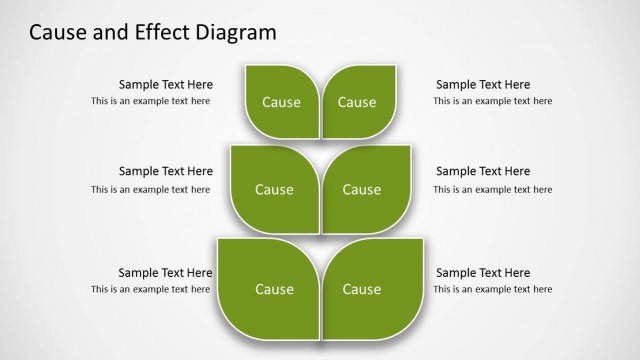
The Cause and Effect Diagram slide from the Green Cause & Effect Diagram for PowerPoint template offers a clear visual tool for root cause analysis and process improvement discussions. This slide layout uses editable shapes and vector icons to map out causal relationships effectively, making it suitable for strategic planning sessions and business presentations that require detailed analysis of underlying factors.
What’s on This Slide
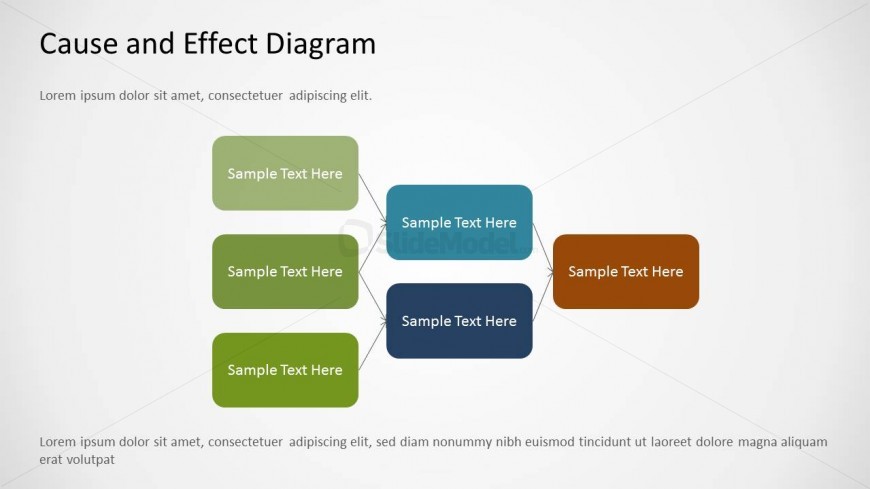
The slide features a cause and effect diagram with a central node connected to multiple surrounding nodes. Three nodes are positioned vertically on the left, colored in green, while three nodes are arranged horizontally on the right, with varying colors including blue and brown. Connecting lines extend from the left nodes to the right nodes, indicating relationships. Text placeholders are present in each node, aligned centrally. A title is positioned at the top left, with a subtitle beneath it. The background is a light gradient, enhancing visual clarity.
How to Use It
This layout serves as a cause and effect diagram, ideal for illustrating relationships between factors in a process. It fits well in a presentation sequence following problem identification slides, allowing for analysis of root causes. This structure is useful in business scenarios such as quality control discussions, project management reviews, or strategic planning sessions where understanding causal relationships is essential.
Text Placeholders & Capacity
Keep your copy within these limits so it fits without resizing. Node text slots can accommodate roughly 30 characters each.
| Placeholder | Count | Max characters (approx.) |
|---|---|---|
| Slide title | 1 | 30 |
| Subtitle | 1 | 80 |
| Item body | 6 | 30 |
Slide Keywords
Download unlimited PowerPoint templates, charts and graphics for your presentations with our annual plan.
DOWNLOADReturn to Green Cause & Effect Diagram for PowerPoint.