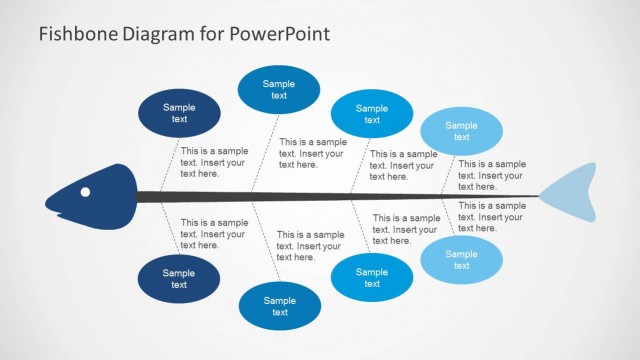
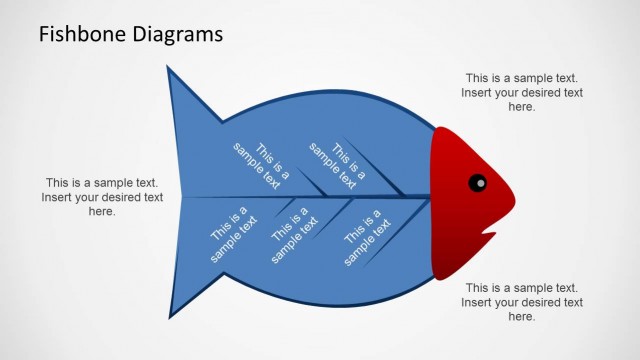
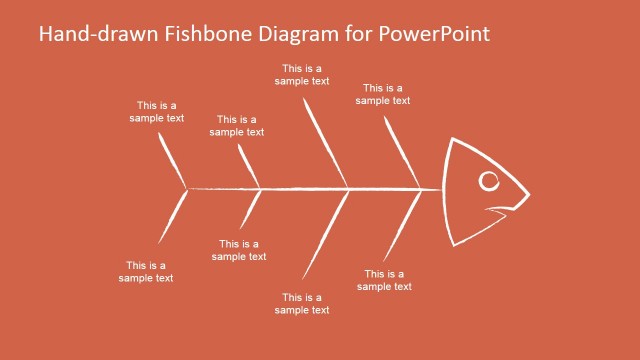
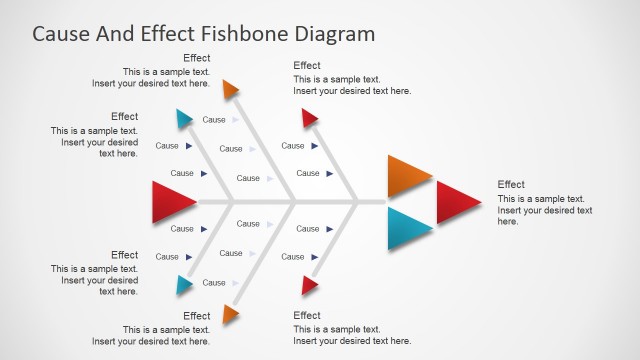
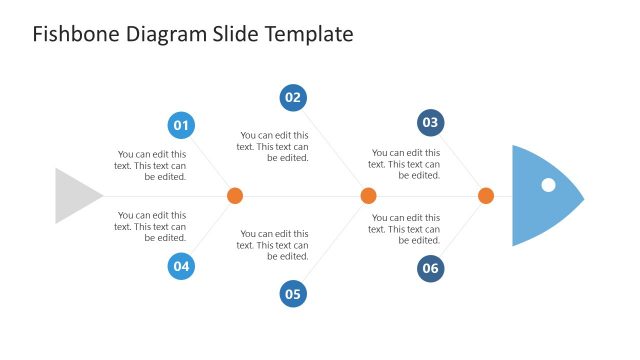
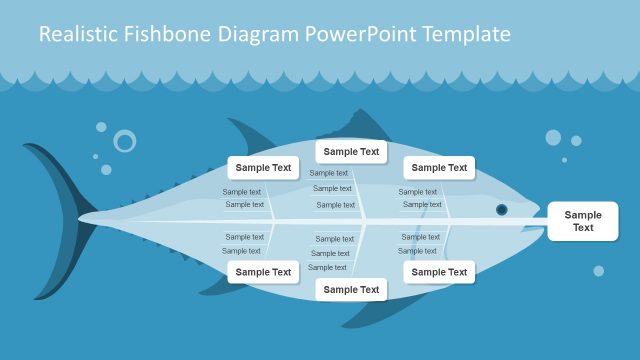
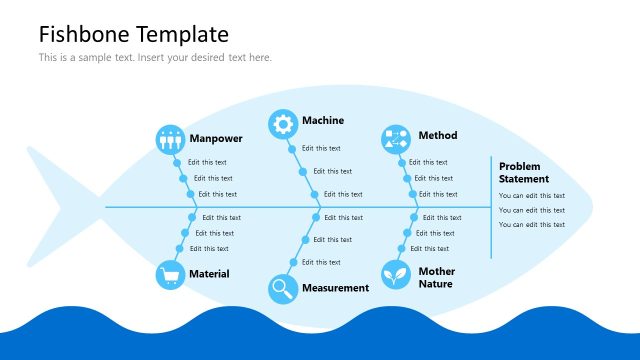
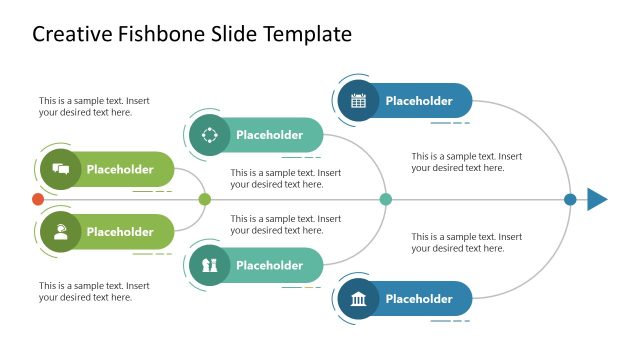
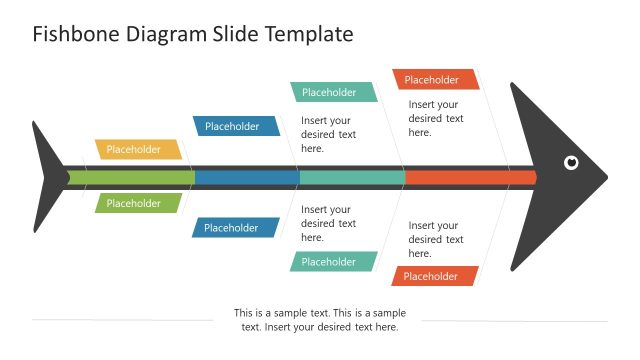
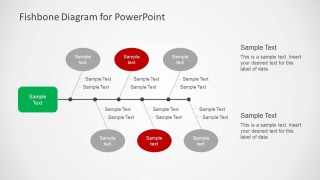
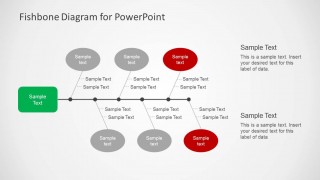
Simple Fishbone Diagram for PowerPoint is a simple representation of cause & effect diagram using the fishbone shape.
Fishbone diagrams for PowerPoint can help you to make presentations using creative cause & effect slide designs. Alternatively you can download other creative fishbone PowerPoint templates and slide designs as well as original timelines for PowerPoint like the fish bowl template.
What’s inside this template
Example presentation scenarios
- A quality manager can use the full fishbone layout to guide a defect analysis meeting and organize possible causes around the main effect box.
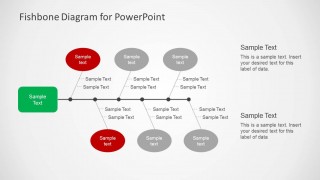
- An operations analyst can use the highlighted cause-node variants to compare suspected drivers of a recurring process issue during a team review.
- A project manager can use the side text callouts to summarize evidence, assumptions, or next actions after a root cause brainstorming session.
- A consultant can use the red and gray cause categories to separate primary issues from supporting causes in a client problem diagnosis.
Features
- 100% editable presentation template
- Compatible with Microsoft PowerPoint and Google Slides
- Scalable vector shapes, icons and illustrations
- AI-Ready for Microsoft Copilot and Claude
- Instant access and download
Frequently asked questions
Q: How should a presenter structure the root cause story with this fishbone diagram?
A: Start by naming the effect in the green box, then walk along the spine from left to right and explain each branch as a cause group. Use the oval nodes for major categories and the small labels for specific contributors. Reserve the highlighted red nodes for causes that need the most discussion or action.
Q: When is this template the right choice for a business or operations team?
A: This template works best when a team already knows the problem statement and needs a shared structure for diagnosing why it happens. It is suitable for quality reviews, incident retrospectives, process improvement meetings, and consulting workshops where the message is about relationships between causes, not detailed metrics or schedules.
Q: Why does the fishbone metaphor improve communication during cause-and-effect analysis?
A: The fishbone metaphor separates the final effect from the contributing causes, so the audience can see the logic of the analysis at a glance. The central spine provides direction, while angled branches prevent cause lists from becoming flat bullet points. Red highlights add priority without changing the overall structure.
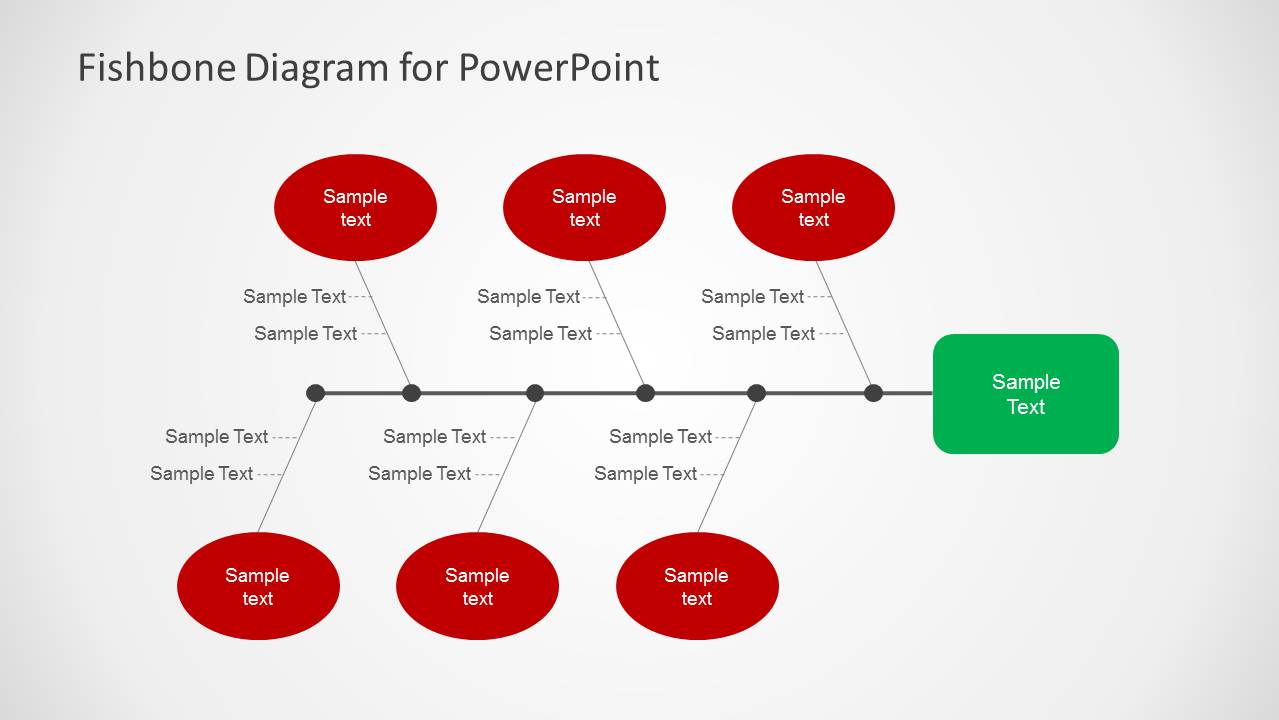


Simple Fishbone Diagram for PowerPoint
4-slide presentation template for fishbone diagrams, root cause analysis, and cause-and-effect mapping
Simple Fishbone Diagram for PowerPoint is a 4-slide cause-and-effect diagram template for root cause analysis. It includes a full fishbone layout, left-to-right fishbone variants, highlighted cause nodes, side text callouts, and editable label areas. It is intended for teams explaining contributing factors behind a problem in PowerPoint.


 Loading...
 Microsoft PowerPoint
  Microsoft Copilot
  Claude for PowerPoint
 Other formats supported
Subscribe today and get immediate
access to download our PowerPoint templates.