Slide 3 of 4 from Green Cause & Effect Diagram for PowerPoint
Cause & Effect Analysis Slide Design for PowerPoint
Cause and Effect Tree Diagram for Presentations
- Diagram
- Tree Hierarchy
- Strategic Analysis Slide
- 16:9
- 100% Editable
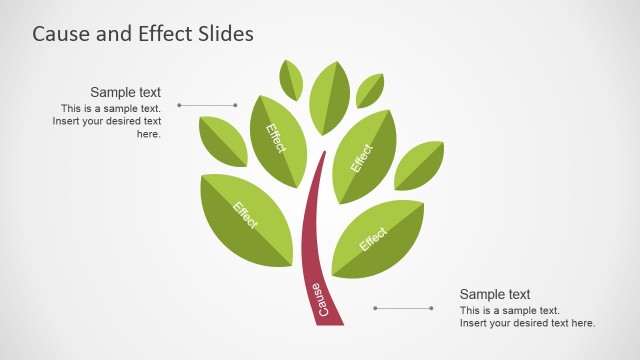
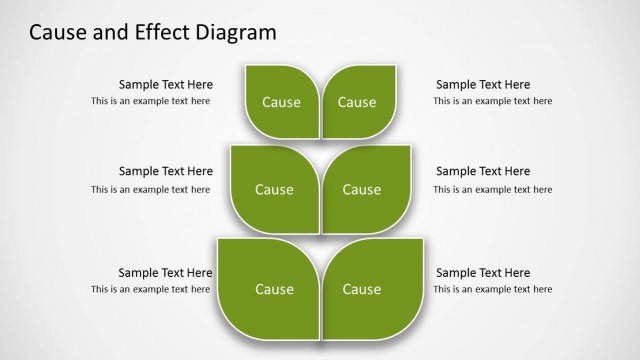
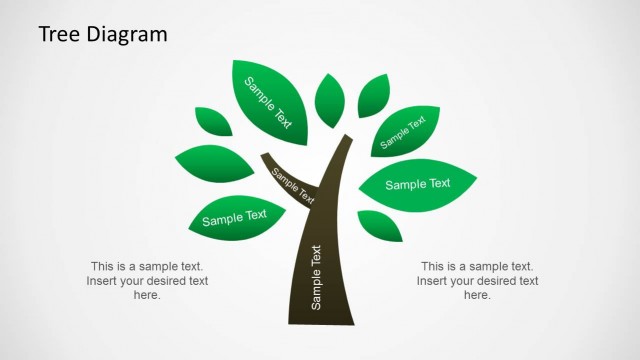
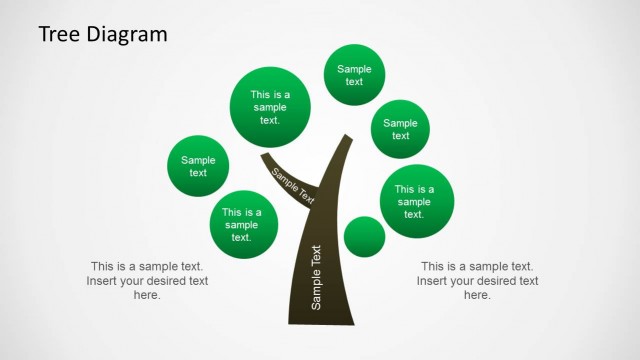
The Cause and Effect Tree Diagram slide from the Green Cause & Effect Diagram for PowerPoint template offers a clear visual hierarchy to analyze root causes effectively. This slide layout, featuring editable shapes and vector icons, is well-suited for strategic planning and project management presentations. Its design supports business presentation needs by simplifying complex cause-and-effect relationships, making it a practical addition to any corporate slide deck or pitch deck template.
What’s on This Slide
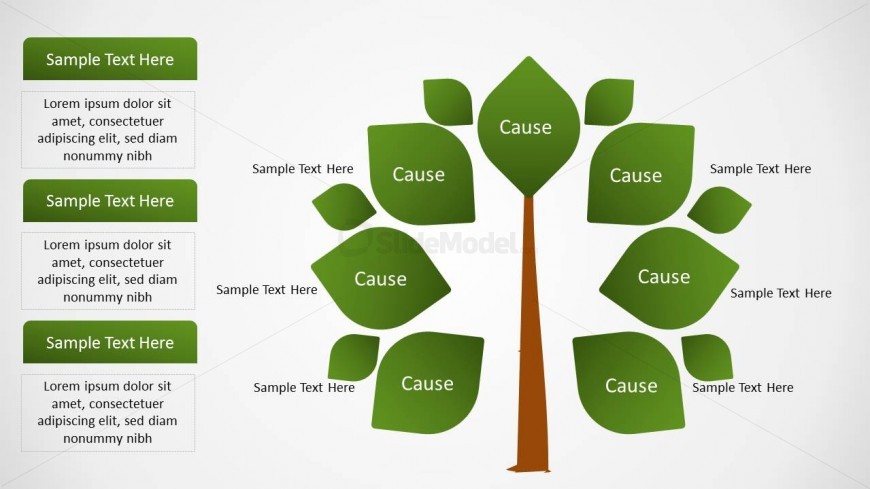
The layout features a central tree trunk with branching leaves representing causes. Leaves are arranged symmetrically on both sides of the trunk, with a total of six leaf shapes. Each leaf has a text placeholder aligned centrally within it. Below the tree, there are four rectangular text placeholders stacked vertically on the left side, with a slight offset from the edge. The background is light, enhancing the green color of the leaves and brown of the trunk. The overall structure emphasizes a clear visual hierarchy, directing attention to the causes represented by the leaves.
How to Use It
This layout serves as a cause-and-effect diagram, ideal for illustrating root causes in a structured format. It fits well in presentations discussing problem analysis or process explanations. This slide can be used in business contexts such as project management, quality control, or strategic planning. It effectively communicates complex relationships in a simplified manner, making it suitable for educational or corporate training sessions.
Text Placeholders & Capacity
Keep your copy within these limits so it fits without resizing. Node labels can hold about 30 characters each, while body paragraphs can fit around 100 characters.
| Placeholder | Count | Max characters (approx.) |
|---|---|---|
| Item heading | 6 | 30 |
| Body paragraph | 4 | 100 |
Slide Keywords
Download unlimited PowerPoint templates, charts and graphics for your presentations with our annual plan.
DOWNLOADReturn to Green Cause & Effect Diagram for PowerPoint.