Slide 2 of 4 from Green Cause & Effect Diagram for PowerPoint
Root Cause and Effect Diagram Design for PowerPoint
Cause and Effect Diagram for Presentations
- Diagram
- Cause Effect
- Strategic Analysis Slide
- 16:9
- 100% Editable
About This Slide
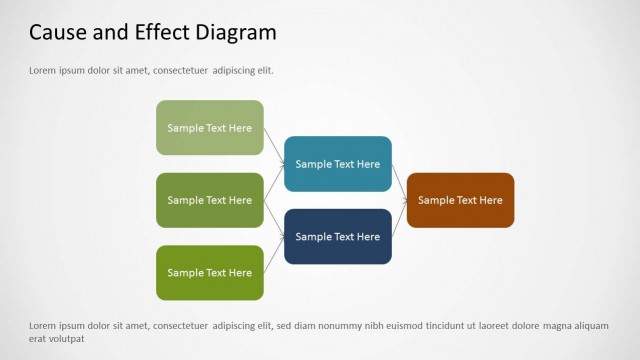
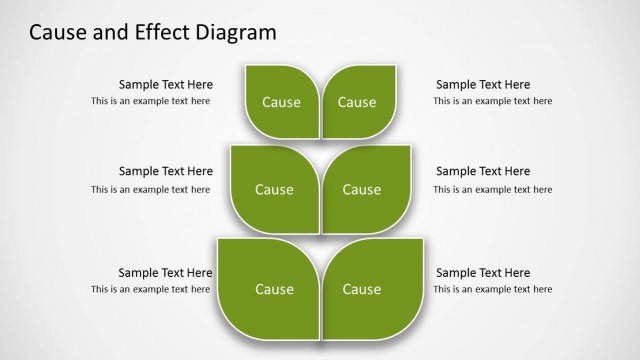
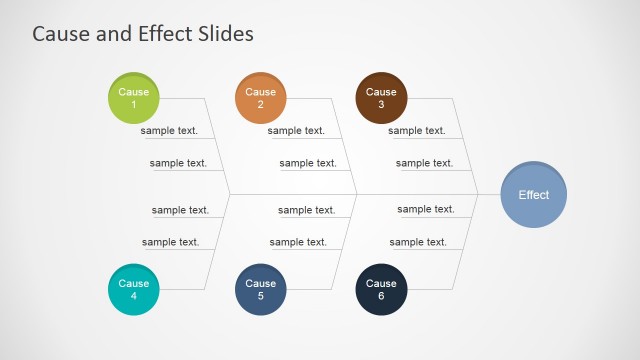
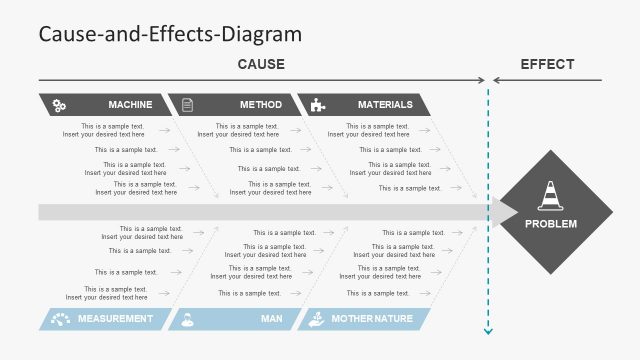
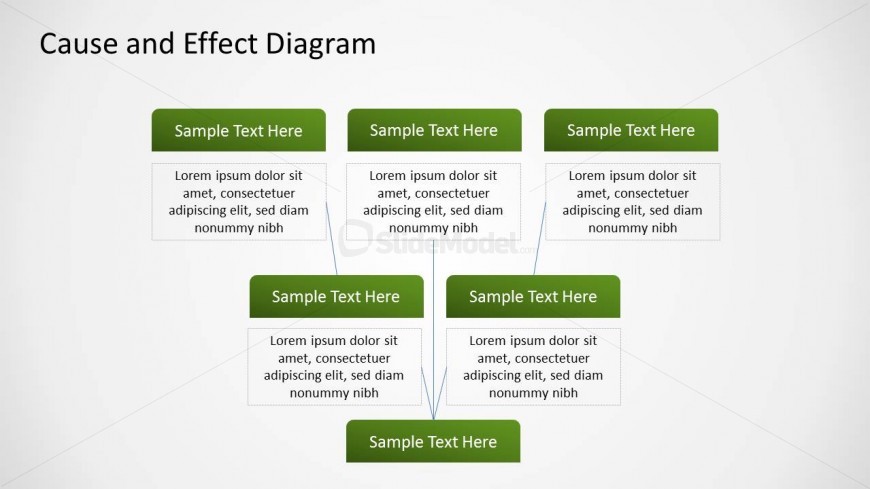
Simple slide design with a tree diagram that you can use for root analysis and cause & effect PowerPoint presentations.
What’s on This Slide
The layout features a central title at the top, labeled 'Cause and Effect Diagram.' Below, there are three upper boxes aligned horizontally, each containing a text placeholder for a title. Below these, there are three additional boxes, also aligned horizontally, connected by downward arrows to the upper boxes. Each of these boxes has a text placeholder for detailed descriptions. The overall structure is symmetrical, with a clear visual hierarchy from the title to the boxes. Background colors are light, enhancing readability.
How to Use It
This layout serves as a cause and effect diagram, ideal for illustrating relationships between causes and their effects. It fits well in presentations discussing problem-solving, root cause analysis, or process mapping. The structure allows for clear categorization of causes leading to specific effects, making it suitable for business scenarios such as project planning, quality control discussions, or strategic analysis. It is best used after presenting a problem to explore underlying causes.
Text Placeholders & Capacity
Keep your copy within these limits so it fits without resizing. Node body slots can hold approximately 15-20 words each.
| Placeholder | Count | Max characters (approx.) |
|---|---|---|
| Slide title | 1 | 30 |
| Item heading | 6 | 25 |
| Item body | 6 | 100 |
Slide Keywords
Download unlimited PowerPoint templates, charts and graphics for your presentations with our annual plan.
DOWNLOADReturn to Green Cause & Effect Diagram for PowerPoint.