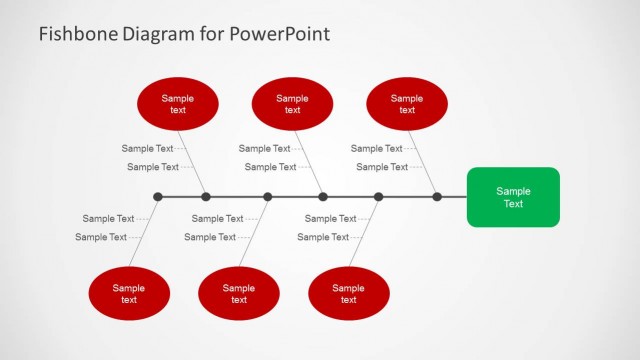
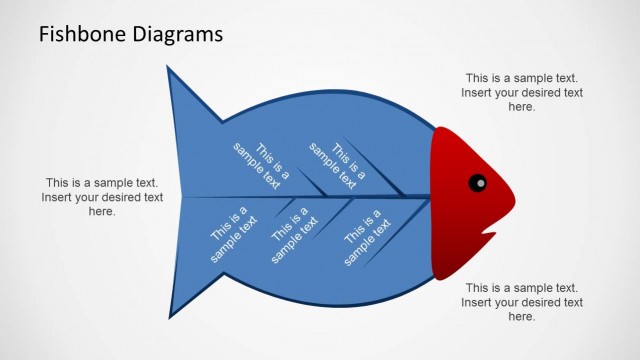
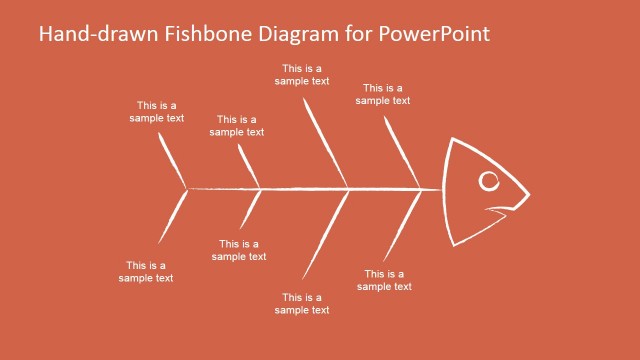
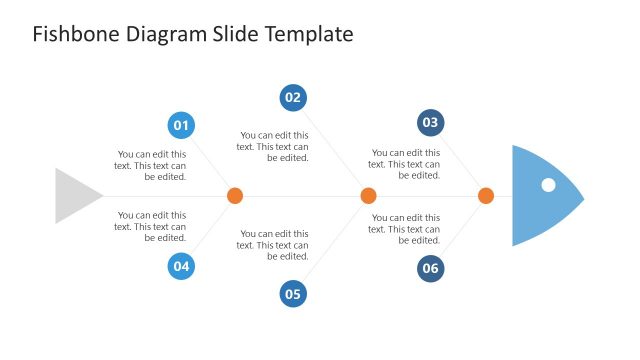
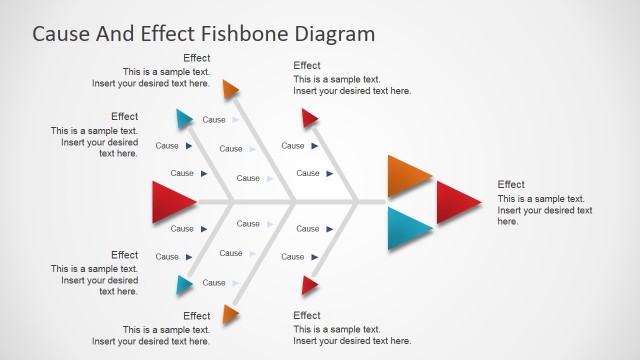
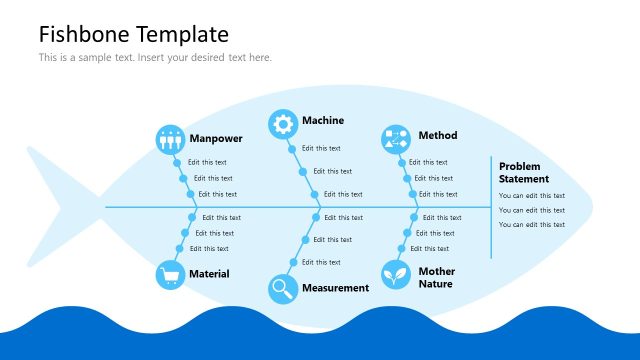
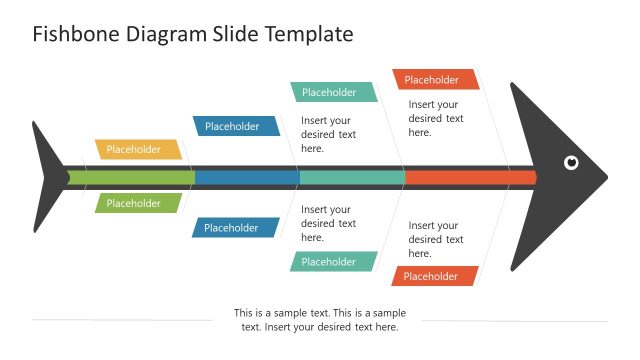
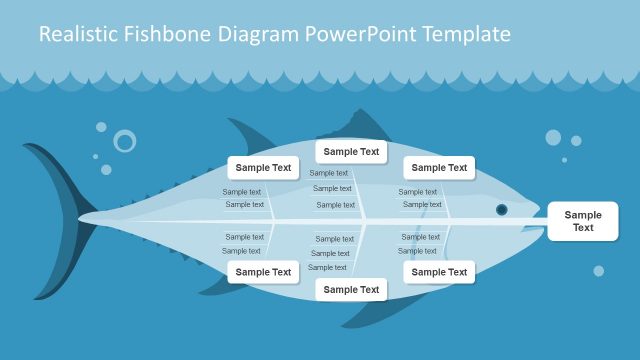
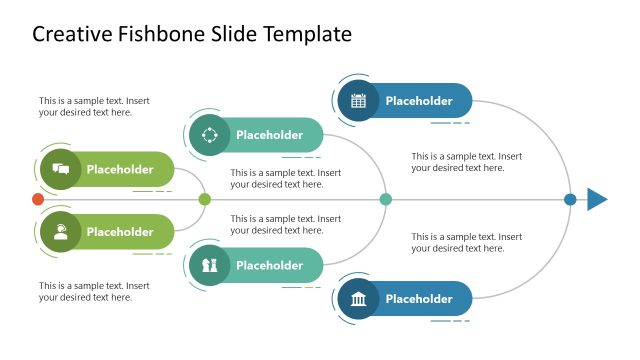
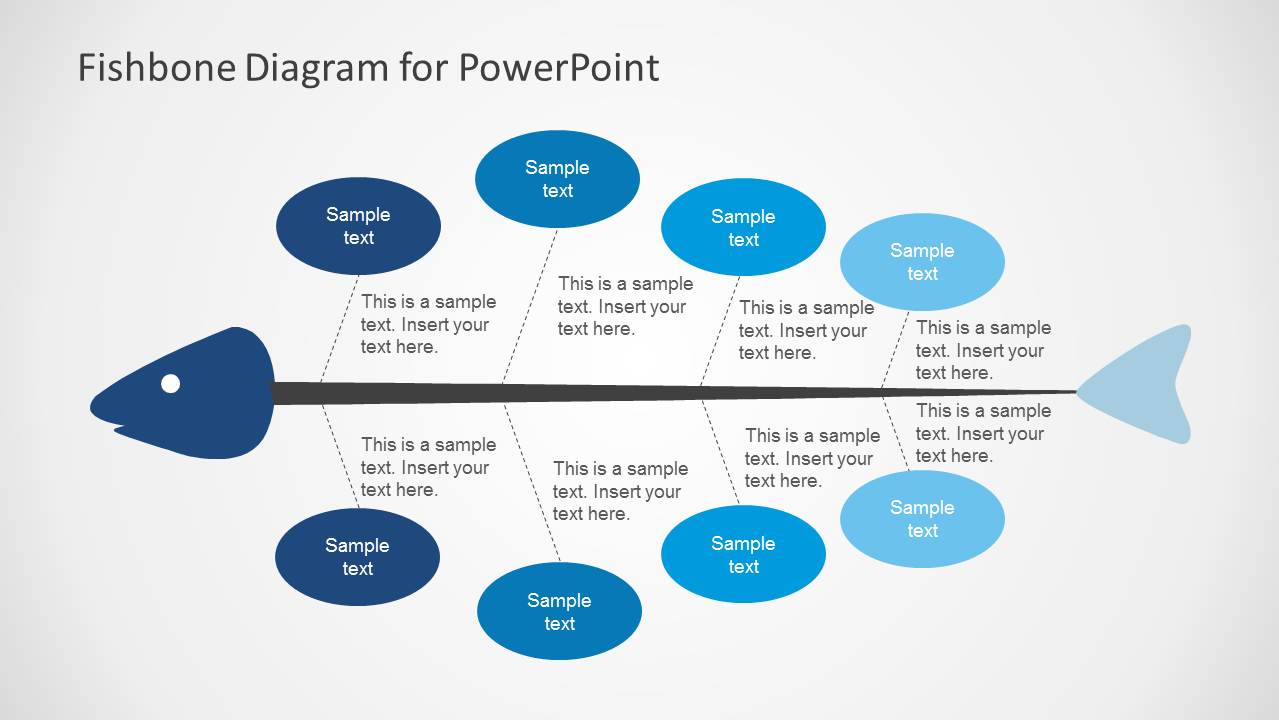
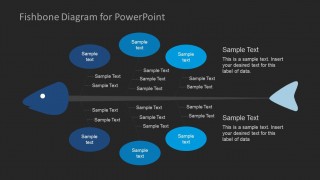
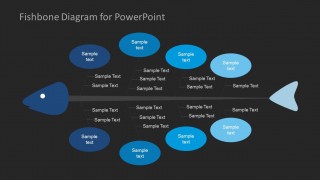
Fishbone Diagram for PowerPoint is a fishbone template that you can download to represent your cause & effect information using a fishbone shape.
This slide set features multiple fishbone designs, including slides which depict different parts of a Fishbone Diagram. This can help you not only create comprehensive standalone diagrams but also to explain various sections of your Fishbone Diagram in the form of individual slides.
What’s inside this template
Example presentation scenarios
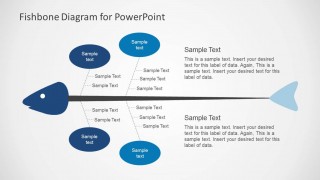
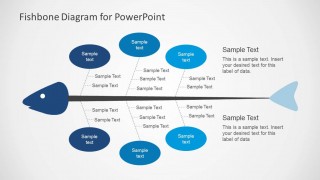
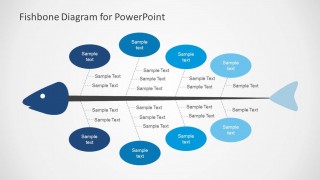
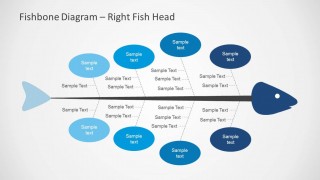
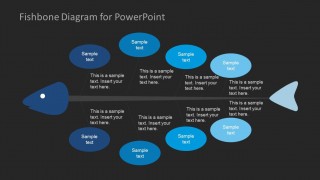
- A quality manager can use the full fishbone diagram to lead a defect review, separating likely causes into oval category labels and branch-level supporting details.
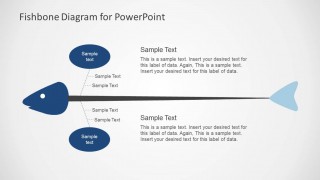
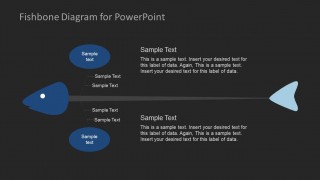
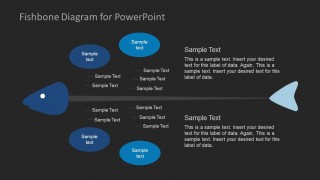
- A process improvement consultant can use the simplified two-branch layout to introduce a workshop topic before expanding into the full eight-category fishbone slide.
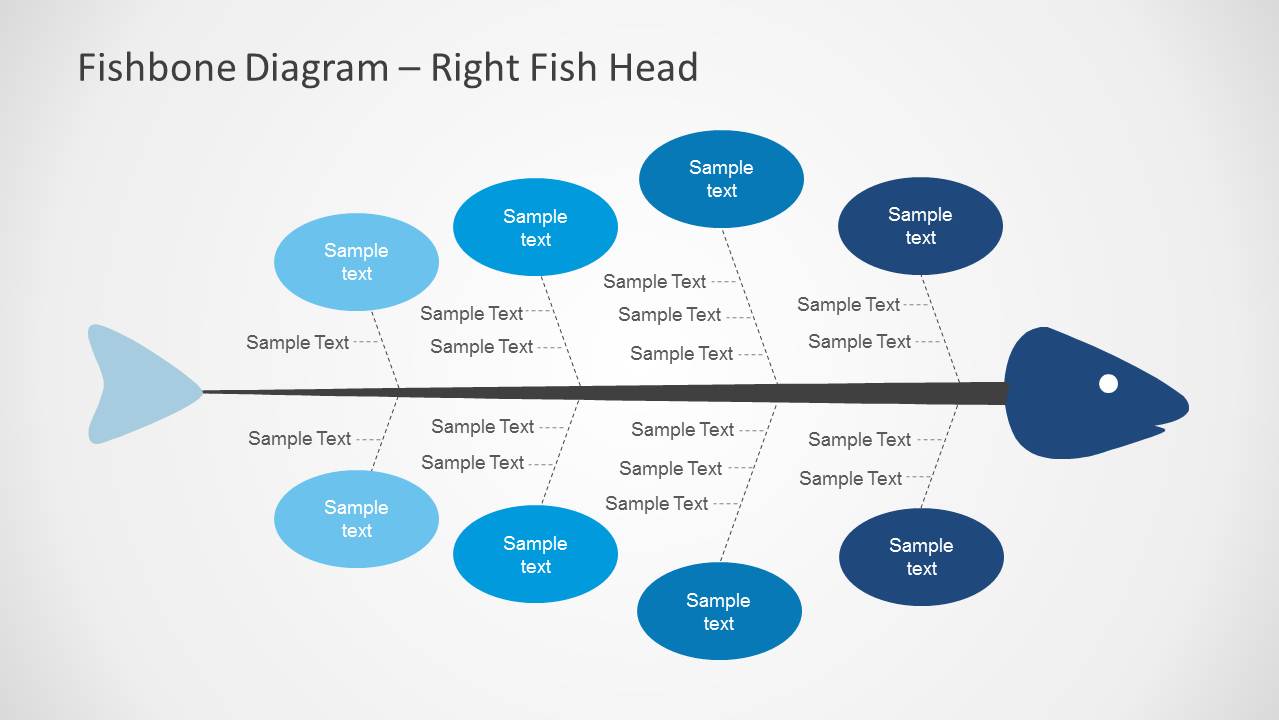
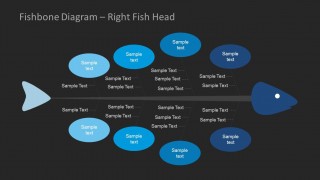
- An operations leader can use the mirrored right-head diagram to fit a root cause discussion into an existing deck sequence that reads toward a final effect on the right.
- A project manager can use the dark-theme callout slides to summarize risks or blockers and explain the most likely causes with supporting text blocks.
Features
- 100% editable presentation template
- Compatible with Microsoft PowerPoint and Google Slides
- Scalable vector shapes, icons and illustrations
- AI-Ready for Microsoft Copilot and Claude
- Instant access and download
Frequently asked questions
Q: How should a presenter structure the root cause discussion with this template?
A: Start with the full fishbone slide to name the main problem along the spine, then group suspected causes into the oval category labels. Use the shorter callout layouts to explain the highest-priority branches in more detail. This keeps the discussion from becoming a list of unrelated issues and helps the audience see cause patterns.
Q: Who is this fishbone diagram template best suited for?
A: It fits presenters who need to guide a structured analysis session, such as quality managers, operations leads, project managers, and consultants. The template is strongest when the goal is to compare possible causes, document team input, and align stakeholders before selecting corrective actions or deeper investigation paths.
Q: Why use the fishbone metaphor instead of a standard list or table?
A: The fishbone shape visually connects many contributing factors to one shared effect, which is harder to show in a table. The spine creates a clear problem axis, while dotted branches and oval labels separate categories from evidence. This metaphor supports discussion because each cause remains tied to the central issue.




Fishbone Diagram for PowerPoint
12-slide PowerPoint presentation template for fishbone cause and effect diagrams with mirrored layouts
Fishbone Diagram for PowerPoint is a 12-slide diagram template for mapping causes and effects. It includes full fishbone diagrams, simplified cause branches, mirrored right-head layouts, and text callout variations in light and dark themes. It is built for process improvement, quality analysis, operations reviews, and problem-solving workshops in PowerPoint.


 Loading...
 Microsoft PowerPoint
  Microsoft Copilot
  Claude for PowerPoint
 Other formats supported
Subscribe today and get immediate
access to download our PowerPoint templates.