Slide 9 of 12 from Fishbone Diagram for PowerPoint
6153-01-fishbone-diagram-9
Fishbone Diagram for Cause and Effect Analysis
- Diagram
- Fishbone
- Strategic Analysis Slide
- 16:9
- 100% Editable
The Fishbone Diagram Layout from the Fishbone Diagram for PowerPoint template offers a structured approach for root cause analysis in business presentations. This slide template features editable shapes and vector icons arranged to facilitate process mapping and quality improvement discussions. Ideal for workshop facilitation, it integrates seamlessly into corporate presentation slide decks focused on strategic analysis and problem-solving.
What’s on This Slide
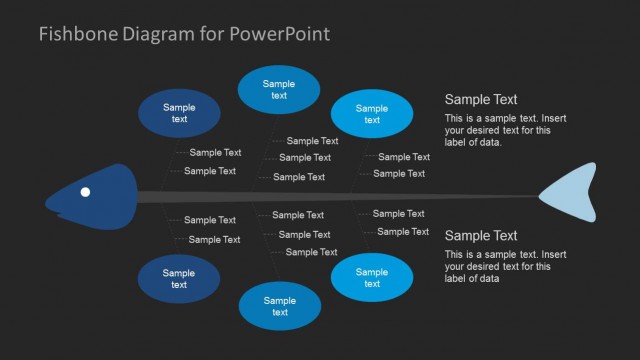
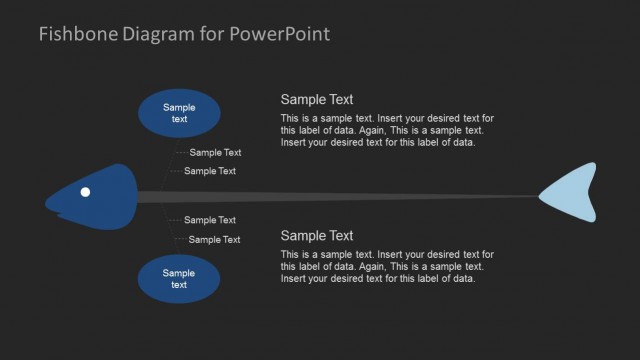
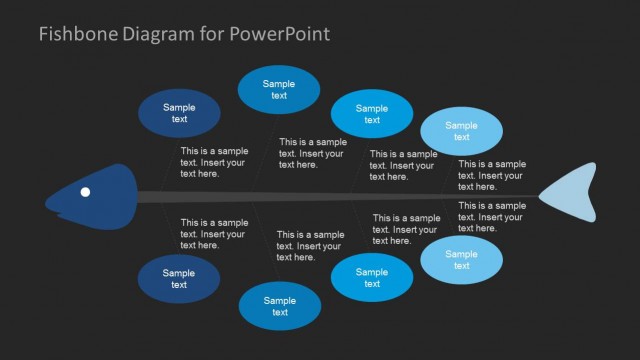
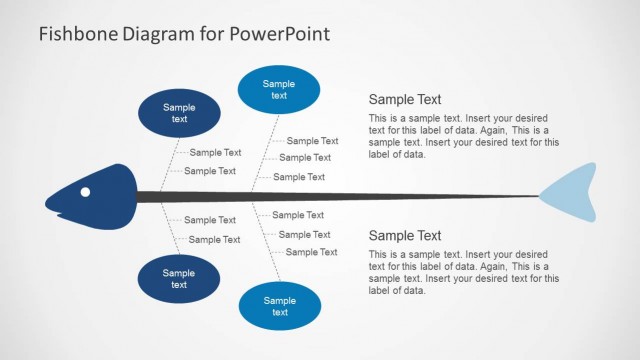
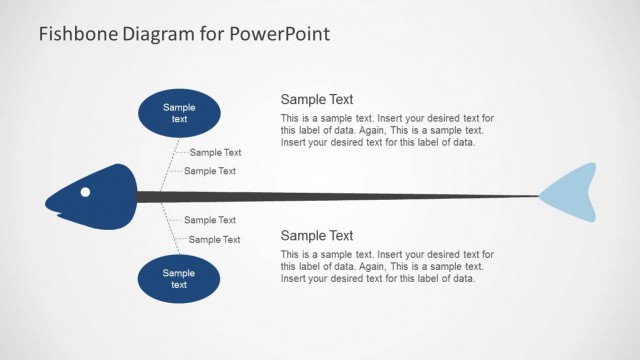
The layout features a fishbone diagram with a central horizontal line extending to the right. On the left side, there are five oval nodes, each containing text placeholders, aligned vertically. The right side contains a larger oval node with additional text placeholders arranged vertically. Each node has a connecting dashed line leading to the central line. The background is dark, enhancing the visibility of the blue and white elements. Text placeholders are positioned within the nodes, with varying sizes indicating hierarchy.
How to Use It
This layout serves as a cause-and-effect diagram, ideal for identifying and analyzing potential causes of a problem. It fits within a presentation sequence after problem identification and before solution proposals. This structure is useful in quality management, process improvement discussions, and workshops focused on root cause analysis, allowing teams to visualize relationships between issues effectively.
Text Placeholders & Capacity
Keep your copy within these limits so it fits without resizing. Node labels can hold about 30 characters each, while body text can accommodate around 100 characters.
| Placeholder | Count | Max characters (approx.) |
|---|---|---|
| Item heading | 5 | 30 |
| Item body | 5 | 100 |
| Chart title | 1 | 50 |
Slide Keywords
Download unlimited PowerPoint templates, charts and graphics for your presentations with our annual plan.
DOWNLOADReturn to Fishbone Diagram for PowerPoint.