Slide 6 of 12 from Fishbone Diagram for PowerPoint
6153-01-fishbone-diagram-6
Fishbone Diagram Right Fish Head Template
- Diagram
- Fishbone
- Problem Framing Slide
- 16:9
- 100% Editable
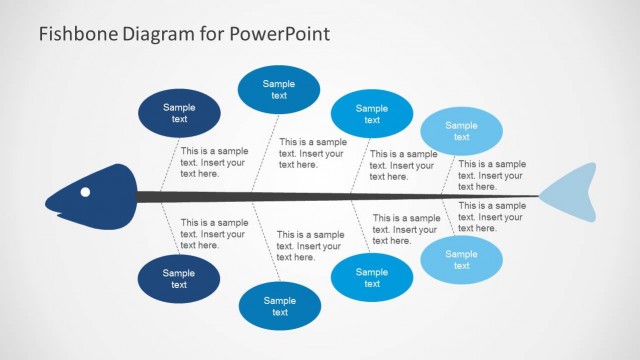
The Fishbone Diagram Right Head slide from the Fishbone Diagram for PowerPoint template offers a clear layout for cause and effect analysis. This slide template uses editable shapes and vector icons to visually organize potential problem causes, making it suitable for business presentations and quality control workshops. Its right-facing fishbone design supports process improvement discussions and strategic planning within corporate slide decks.
What’s on This Slide
The layout features a right-facing fishbone diagram with a central horizontal line representing the spine. The fish head is positioned on the right, with a prominent shape. Multiple oval nodes extend from the spine, arranged in a staggered manner, with connecting dashed lines indicating relationships. The nodes are filled with sample text placeholders, some in light blue and others in dark blue, creating a visual hierarchy. The background is light gray, enhancing visibility. Text placeholders are aligned centrally within the nodes, allowing for easy content insertion.
How to Use It
This layout serves as a cause-and-effect analysis tool, ideal for identifying and organizing potential causes of a problem. It fits well in presentations focused on process improvement or quality analysis. The diagram can be used in workshops to facilitate discussions about root causes. It is effective for visualizing complex relationships in a straightforward manner, making it suitable for team meetings or strategic planning sessions. The right fish head orientation allows for clear presentation of the primary issue being addressed.
Text Placeholders & Capacity
Keep your copy within these limits so it fits without resizing. Node slots can accommodate up to 50 characters each.
| Placeholder | Count | Max characters (approx.) |
|---|---|---|
| Item body | 8 | 50 |
| Slide title | 1 | 40 |
Slide Keywords
Download unlimited PowerPoint templates, charts and graphics for your presentations with our annual plan.
DOWNLOADReturn to Fishbone Diagram for PowerPoint.