Slide 4 of 12 from Fishbone Diagram for PowerPoint
6153-01-fishbone-diagram-4
Fishbone Diagram for Cause and Effect Analysis
- Diagram
- Fishbone
- Strategic Analysis Slide
- 16:9
- 100% Editable
The Fishbone Diagram Layout from the Fishbone Diagram for PowerPoint template provides a structured visual tool for cause and effect analysis. This slide template supports quality improvement workshops and brainstorming sessions by using editable shapes and vector icons to clearly map out potential root causes. Its design enhances corporate presentations and business presentations, making it a practical addition to any slide deck focused on strategic analysis and problem solving.
What’s on This Slide
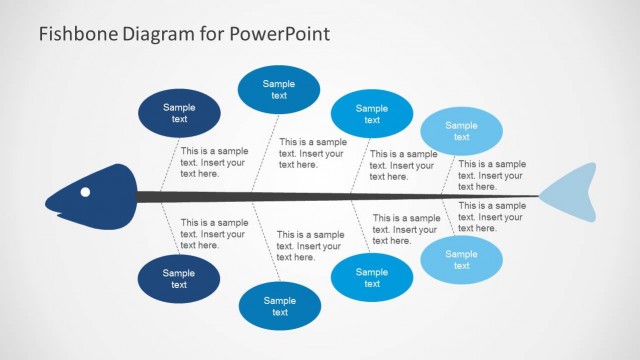
The layout features a central horizontal line representing the spine of a fish, with a fish head on the right. Branching off from the spine are multiple diagonal lines, each leading to oval shapes that contain text placeholders. The ovals are positioned above and below the spine, creating a balanced structure. Each oval is labeled 'Sample text' or 'Sample Text' and has a consistent size. The placeholders are aligned centrally within their shapes. The background is light, enhancing the visibility of the dark blue and light blue elements.
How to Use It
This layout serves as a cause-and-effect diagram, commonly used in quality analysis and problem-solving workshops. It fits well after a problem-framing slide, allowing for a visual exploration of potential causes. Real-world applications include process improvement sessions and operational reviews, where identifying root causes is essential. The structure facilitates discussion and brainstorming among team members, making it suitable for collaborative environments.
Text Placeholders & Capacity
Keep your copy within these limits so it fits without resizing. Node body slots can accommodate roughly 15-20 words each.
| Placeholder | Count | Max characters (approx.) |
|---|---|---|
| Item heading | 6 | 20 |
| Item body | 6 | 100 |
| Chart title | 1 | 50 |
Slide Keywords
Download unlimited PowerPoint templates, charts and graphics for your presentations with our annual plan.
DOWNLOADReturn to Fishbone Diagram for PowerPoint.