Slide 12 of 12 from Fishbone Diagram for PowerPoint
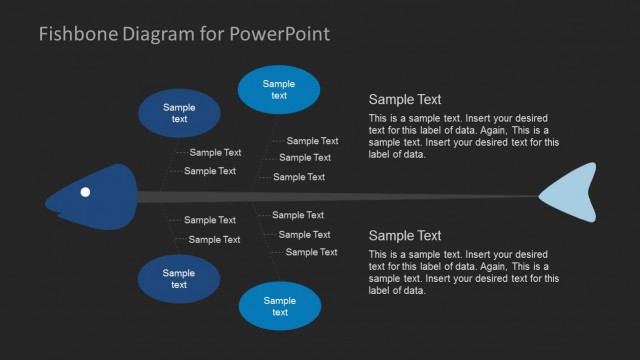
Dark Fishbone Illustration
Fishbone Diagram Right Fish Head for Analysis
- Diagram
- Fishbone
- Strategic Analysis Slide
- 16:9
- 100% Editable
The Fishbone Diagram Right Head slide from the Fishbone Diagram for PowerPoint template offers a structured layout for cause and effect analysis, ideal for quality control discussions and brainstorming sessions. This slide template features editable shapes and vector icons arranged in a clear fishbone diagram, making it suitable for corporate presentations and business presentation slide decks focused on process improvement and root cause identification.
About This Slide
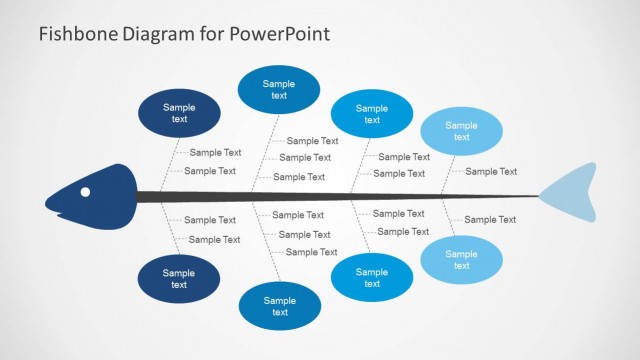
Fishbone diagram for PowerPoint presentations with dark background design and oval shapes. This dark fishbone diagram has four levels (4 level) and editable elements that you can use to present a root cause analysis during a PowerPoint presentation design.
What’s on This Slide
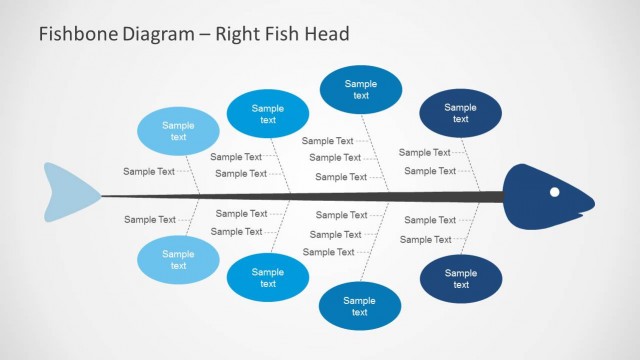
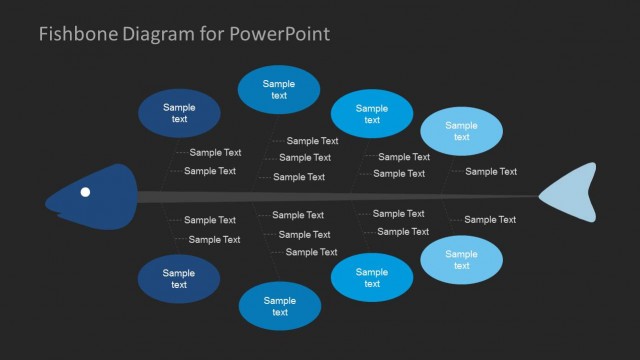
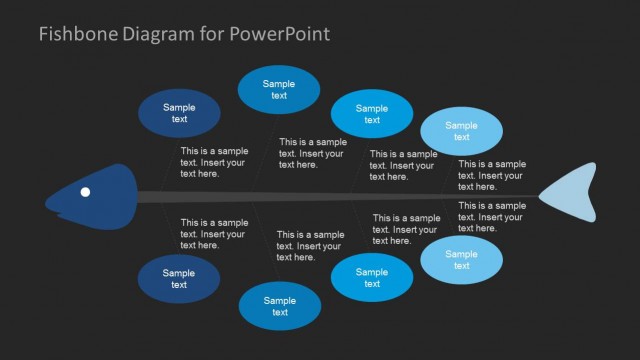
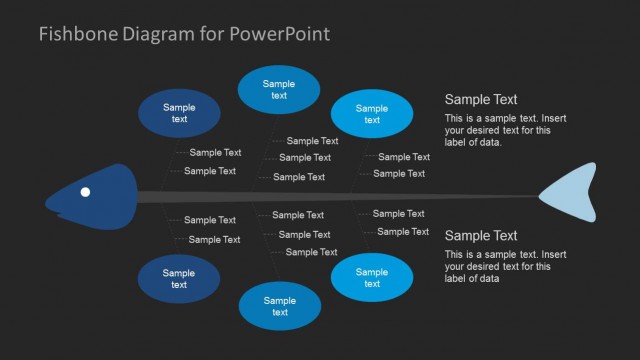
The layout features a right-facing fishbone diagram with a central horizontal line. The fish head is positioned on the right, with a prominent shape indicating the main issue. Multiple oval nodes extend from the spine, with text placeholders aligned horizontally. There are a total of eight nodes on each side, with varying sizes to indicate importance. The background is dark, enhancing the visibility of the blue and light blue elements. Text placeholders are evenly distributed, allowing for clear labeling of causes and effects.
How to Use It
This layout serves as a cause-and-effect analysis tool, ideal for identifying problems and their root causes. It fits well in presentations discussing quality control, process improvement, or operational reviews. The fishbone structure allows for organized brainstorming sessions, making it suitable for workshops. It is particularly effective in collaborative environments where team input is needed to dissect complex issues and visualize relationships among various factors.
Text Placeholders & Capacity
Keep your copy within these limits so it fits without resizing. Node labels can hold up to 30 characters each.
| Placeholder | Count | Max characters (approx.) |
|---|---|---|
| Item heading | 16 | 30 |
| Slide title | 1 | 50 |
Slide Keywords
Download unlimited PowerPoint templates, charts and graphics for your presentations with our annual plan.
DOWNLOADReturn to Fishbone Diagram for PowerPoint.