Slide 7 of 12 from Fishbone Diagram for PowerPoint
6153-01-fishbone-diagram-7
Fishbone Diagram for Cause and Effect Analysis
- Diagram
- Fishbone
- Strategic Analysis Slide
- 16:9
- 100% Editable
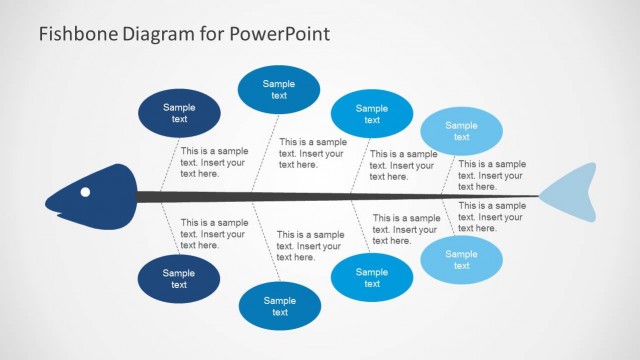
The Fishbone Diagram with Cause Branches slide from the Fishbone Diagram for PowerPoint template offers a structured layout for cause and effect analysis. This slide is designed to facilitate quality improvement discussions and problem-solving workshops, featuring editable shapes that clearly map causes along a central spine. Ideal for business presentations, it supports clear visualization of complex issues using professional slide templates.
What’s on This Slide
The layout features a central horizontal line representing the spine of a fishbone diagram. On either side, there are multiple oval shapes representing causes, positioned at various angles. Each oval contains a text placeholder centered within it, with additional text placeholders aligned vertically along the spine. The overall composition is balanced, with a dark background enhancing the visibility of the shapes. The fish's head is located at the right end, while the tail is on the left, creating a clear directional flow from causes to effects.
How to Use It
This layout serves as a cause-and-effect analysis tool, ideal for identifying potential problems and their sources. It fits well in presentations focused on quality improvement, operational reviews, or problem-solving workshops. The diagram can be used to visually organize and present complex information in a structured manner. It is particularly useful in team discussions or brainstorming sessions where identifying root causes is essential.
Text Placeholders & Capacity
Keep your copy within these limits so it fits without resizing. Node body slots can accommodate roughly 10-12 words each.
| Placeholder | Count | Max characters (approx.) |
|---|---|---|
| Item heading | 6 | 20 |
| Item body | 6 | 50 |
Slide Keywords
Download unlimited PowerPoint templates, charts and graphics for your presentations with our annual plan.
DOWNLOADReturn to Fishbone Diagram for PowerPoint.