Slide 2 of 12 from Fishbone Diagram for PowerPoint
6153-01-fishbone-diagram-2
Fishbone Diagram for PowerPoint Slide 2
- Diagram
- Fishbone
- Problem Framing Slide
- 16:9
- 100% Editable
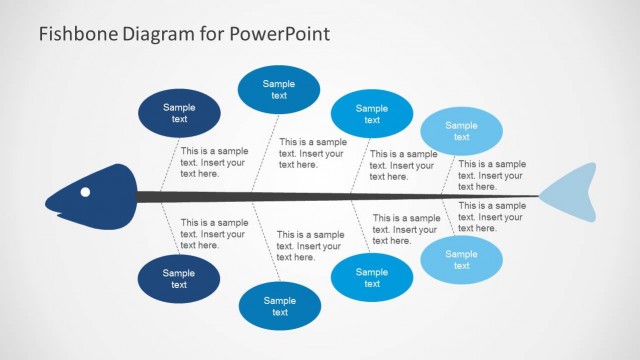
The Fishbone Diagram Layout from the Fishbone Diagram for PowerPoint template provides an editable slide designed for cause and effect analysis in business presentations. This slide template features vector icons and editable shapes arranged to facilitate root cause identification during quality improvement meetings and brainstorming sessions. Its clear structure supports effective problem framing within corporate presentation slide decks.
What’s on This Slide
The slide features a fishbone diagram with a central horizontal line representing the spine. On the left, a large fish head shape contains a text placeholder labeled 'Sample text.' Branching off the spine are several smaller lines with text placeholders labeled 'Sample Text.' These lines are positioned at varying angles, creating a structured layout. The background is light, enhancing visibility. The overall composition is balanced, with elements evenly spaced, allowing for clear text entry. There are no images or media placeholders present.
How to Use It
This layout serves as a cause-and-effect analysis tool, ideal for identifying and organizing potential causes of a problem. It fits well in a presentation sequence after a problem statement, guiding discussions on root causes. Common scenarios include quality improvement meetings, operational reviews, and brainstorming sessions. The diagram helps teams visualize complex relationships and prioritize issues effectively, making it suitable for workshops and strategic planning sessions.
Text Placeholders & Capacity
Keep your copy within these limits so it fits without resizing. Node body slots can hold approximately 2-3 sentences each.
| Placeholder | Count | Max characters (approx.) |
|---|---|---|
| Item heading | 6 | 50 |
| Item body | 6 | 150 |
| Slide title | 1 | 30 |
Slide Keywords
Download unlimited PowerPoint templates, charts and graphics for your presentations with our annual plan.
DOWNLOADReturn to Fishbone Diagram for PowerPoint.