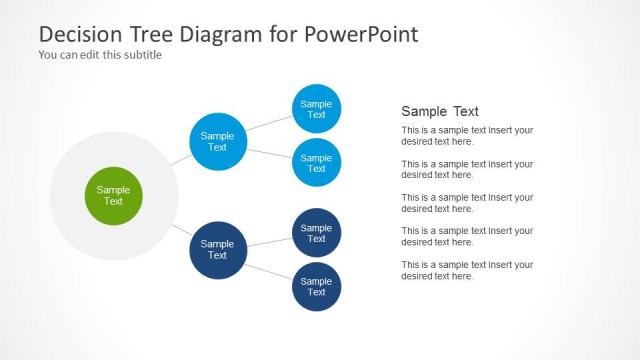
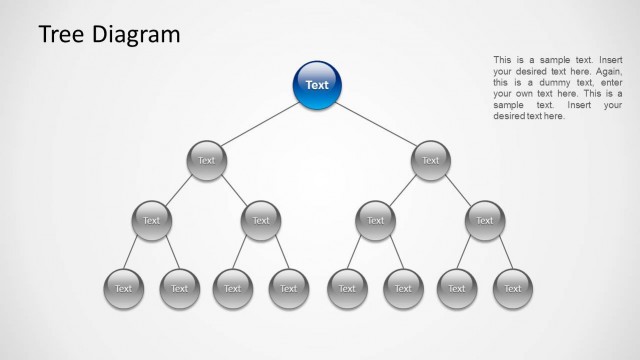
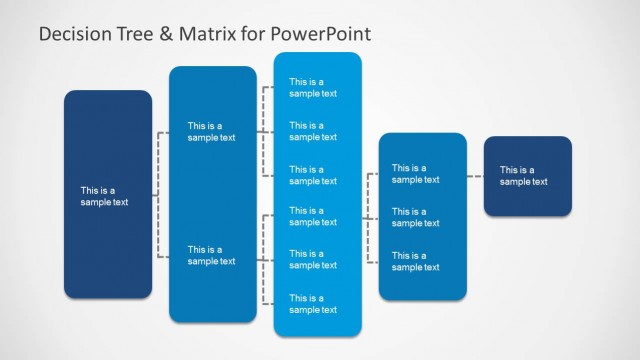
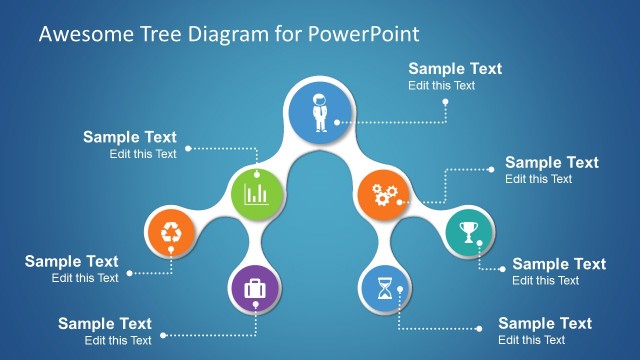
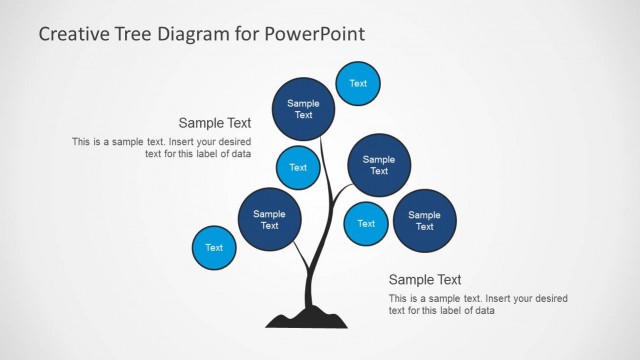
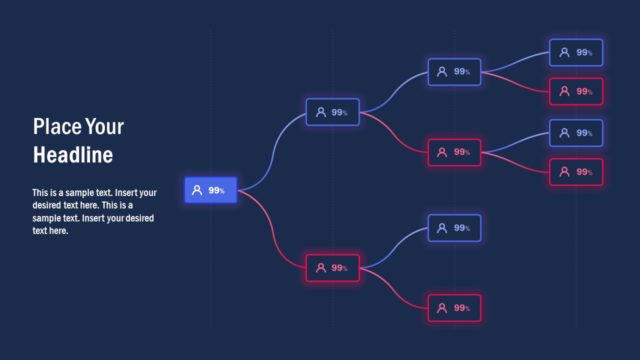
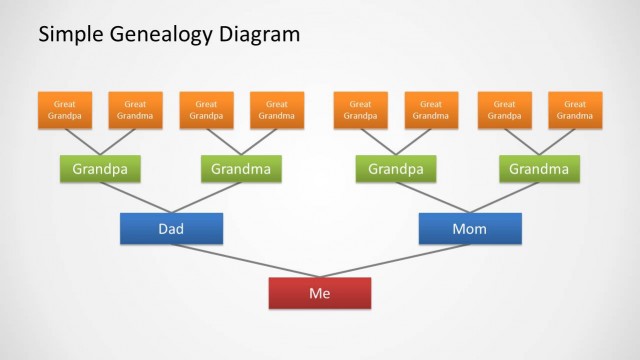
Decision Tree Diagram with Text Boxes for PowerPoint is a presentation template containing useful slides that you can use in presentations on decision making or probability trees.
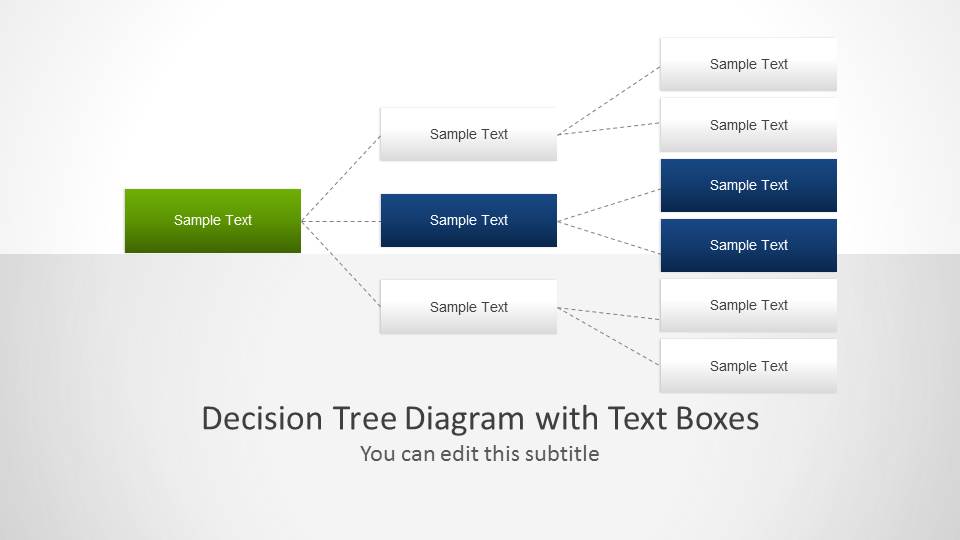
You can use this presentation template with tree diagram to model your decision trees and help visualize the decision options in a PowerPoint presentation. This decision tree template is an alternative to standard tree diagrams in PowerPoint that was created using PowerPoint shapes and provides editable text boxes.
What’s inside this template
Example presentation scenarios
- A business analyst can use the left-to-right decision tree to compare alternative paths and explain how each branch leads to a specific outcome.
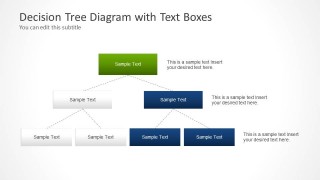
- A sales manager can use the top-down branching layout to present qualification steps and show how customer responses move through a sales tree.
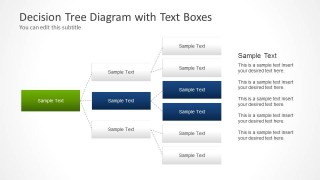
- A consultant can use the diagram with right-side callouts to walk executives through decision criteria while keeping detailed assumptions beside the branches.
- An educator can use the root node and terminal node structure to teach probability paths, cause-and-effect logic, or genealogy relationships.
Features
- 100% editable presentation template
- Compatible with Microsoft PowerPoint and Google Slides
- 16:9 aspect ratio slides
- Scalable vector shapes, icons and illustrations
- AI-Ready for Microsoft Copilot and Claude
- Instant access and download
Frequently asked questions
Q: How should I explain a decision tree clearly with this template?
A: Start with the root node and define the decision being made before discussing any branches. Then move one level at a time, explaining the criteria that split each path. Use the blue nodes for the branch you want the audience to notice most, and reserve the callout text for assumptions, risks, or selection rules.
Q: Who is this template best suited for?
A: This template fits presenters who need to make branching logic visible: analysts explaining decision criteria, sales leaders mapping qualification paths, consultants comparing scenarios, and educators teaching probability or relationships. It works best when the audience needs to see how one starting point can lead to several possible outcomes.
Q: Why use the tree metaphor instead of a table of options?
A: A tree diagram shows dependency between choices, which a table often hides. The root node establishes the starting decision, the connectors show cause-and-effect movement, and the terminal nodes make outcomes easy to compare. The added text boxes let the presenter explain reasoning without overcrowding the branches.


Decision Tree Diagram with Text Boxes for PowerPoint
3-slide decision tree presentation template with branching nodes and text boxes for choice mapping
Decision Tree Diagram with Text Boxes for PowerPoint is a 3-slide diagram template for mapping choices, probabilities, and outcomes. It includes a left-to-right decision tree, a tree with explanatory callouts, and a top-down branching layout. It is built for Microsoft PowerPoint and Google Slides.
- Category
- Tree Diagrams
- Rating


 Loading...
- Aspect ratio
- 16:9
- Item ID
- 6108-02
- Colors
 Microsoft PowerPoint
  Microsoft Copilot
  Claude for PowerPoint
 Other formats supported
Subscribe today and get immediate
access to download our PowerPoint templates.