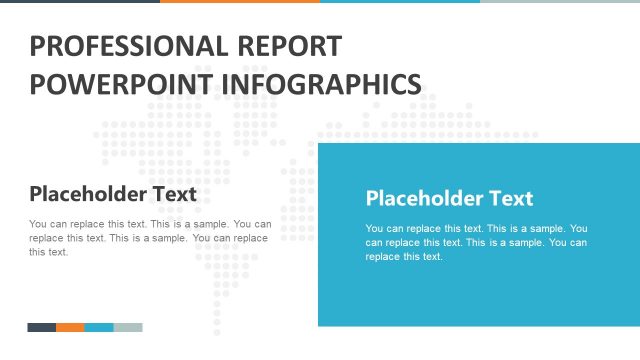
Business Statistics Infographic Template for PowerPoint
Showcase the complex statistical data about your company using this creative Business Statistics Infographic Template for PowerPoint. Business statistics involve various types of business data like financial data, sales data, cost and profit data, annual revenue, net profits, average costs, marketing budgets, operational budgets, HR data, and employee data. We need graphical representations to convey the message and make the information accurate and understandable to present the statistical information. Otherwise, thousands of rows in Excel are not a good source for communicating business information to the stakeholders. For this purpose, we have created this business statistics infographic template to present the complicated information in attractive visualizations, diagrams, and tables. Professionals from multiple domains can benefit from this statistics & results PowerPoint template in business meetings.
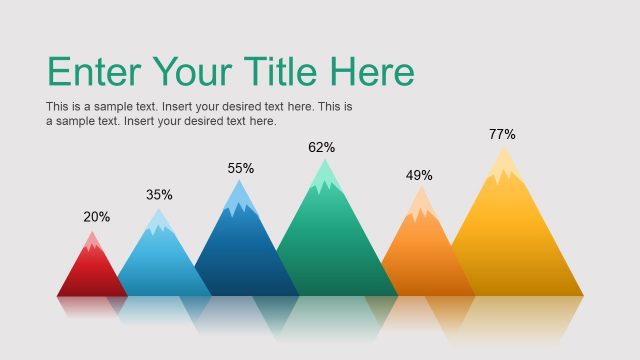
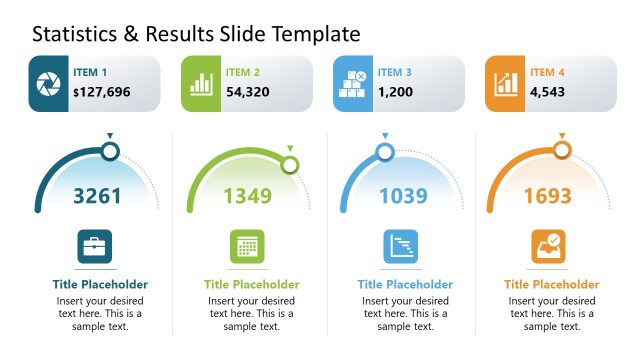
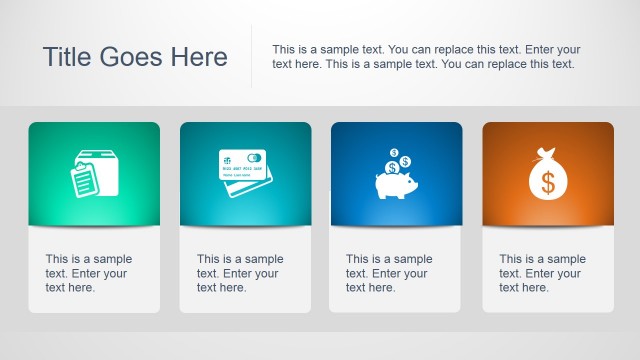
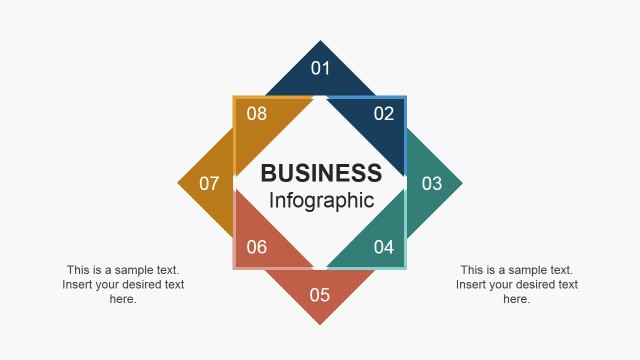
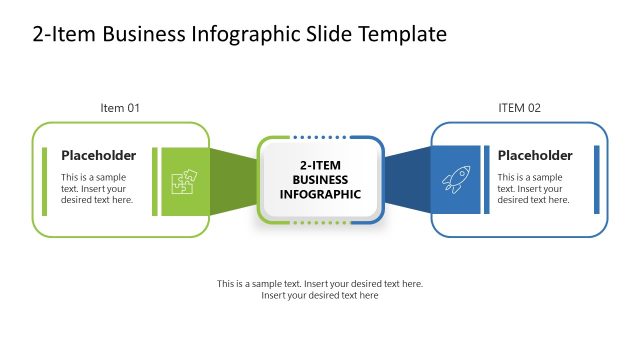
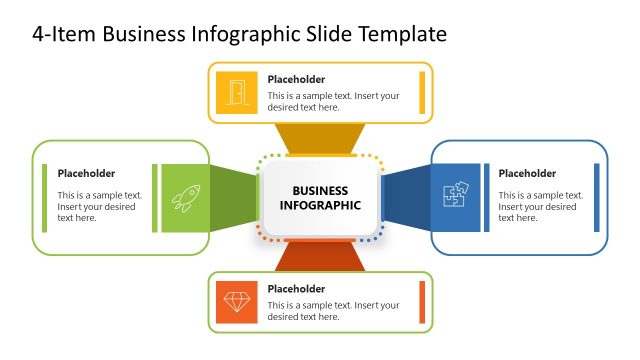
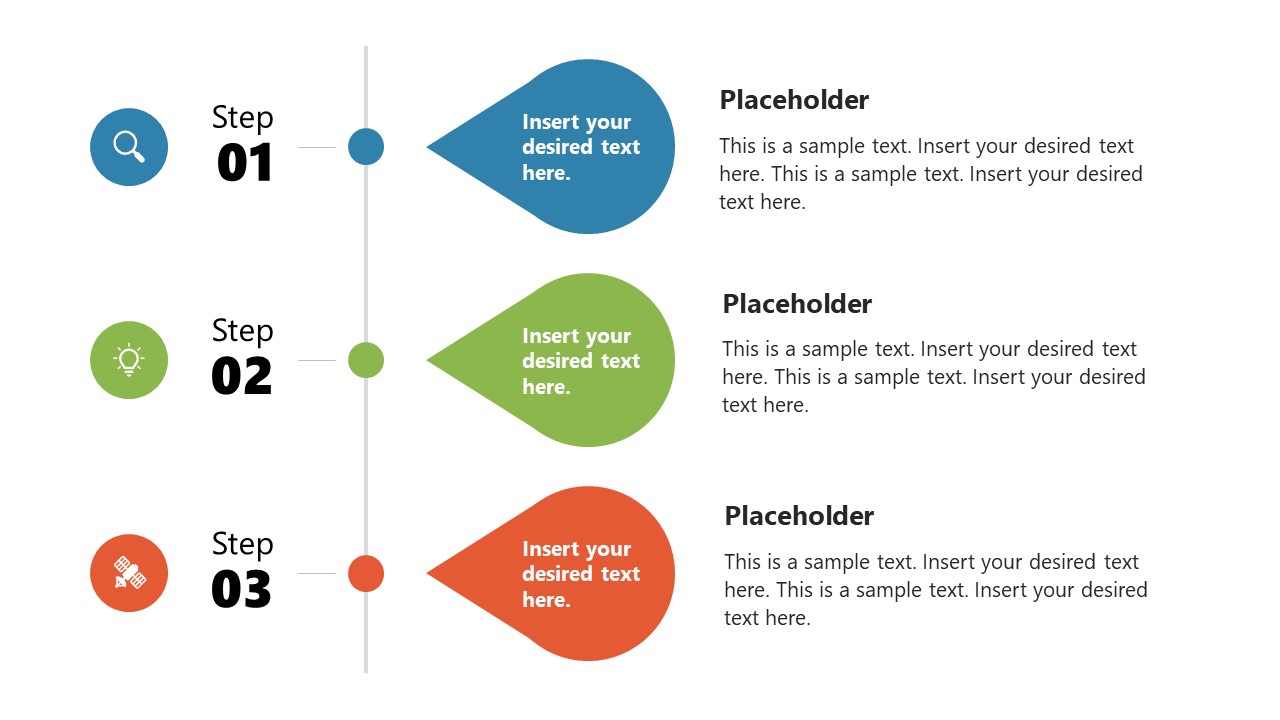
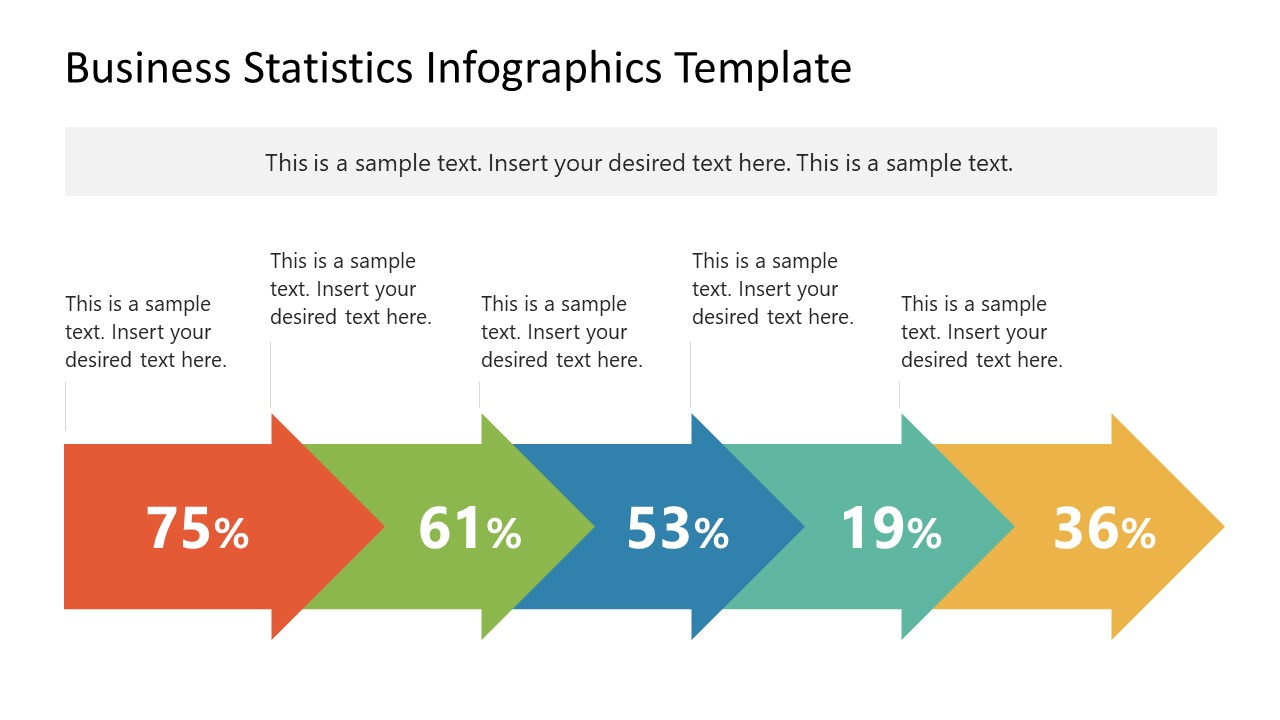
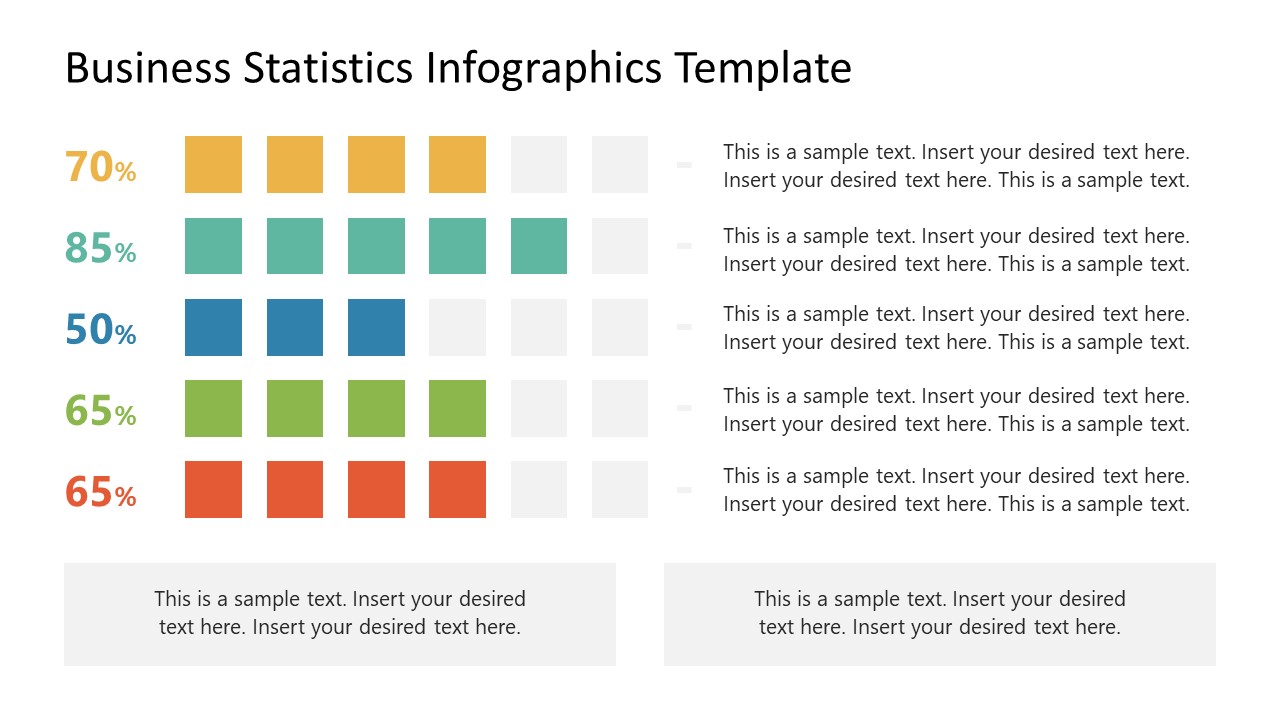
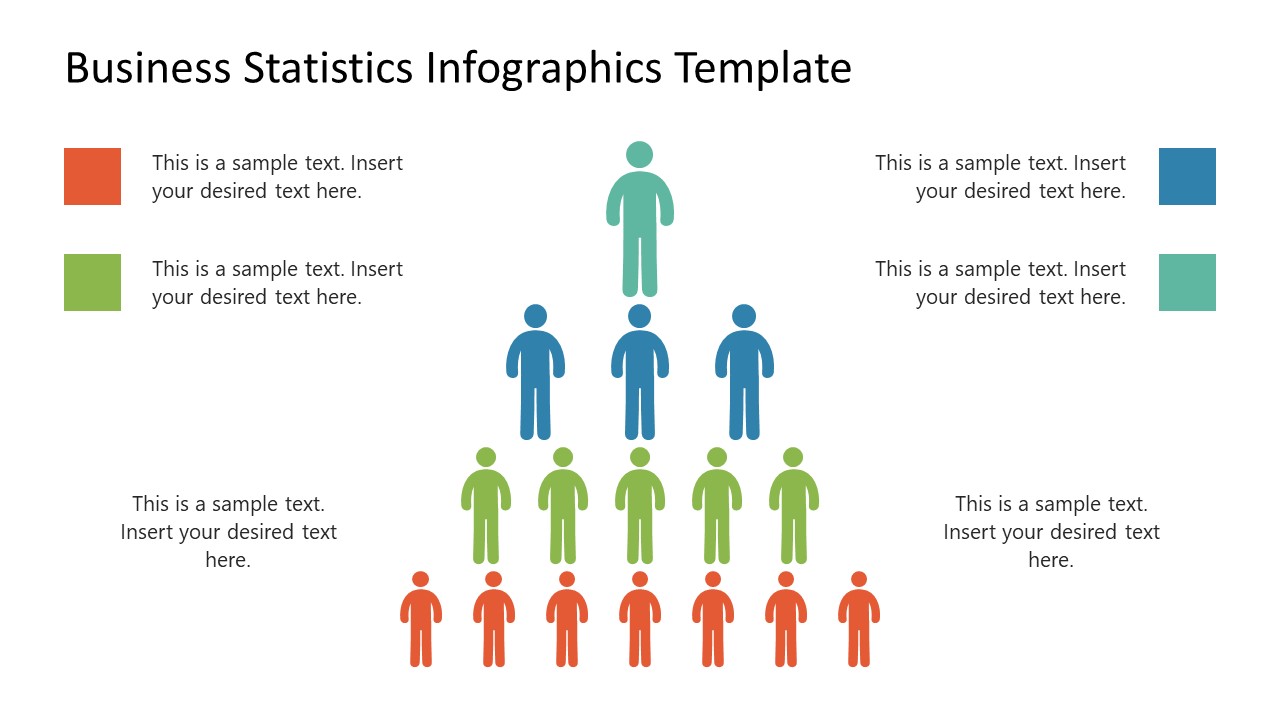
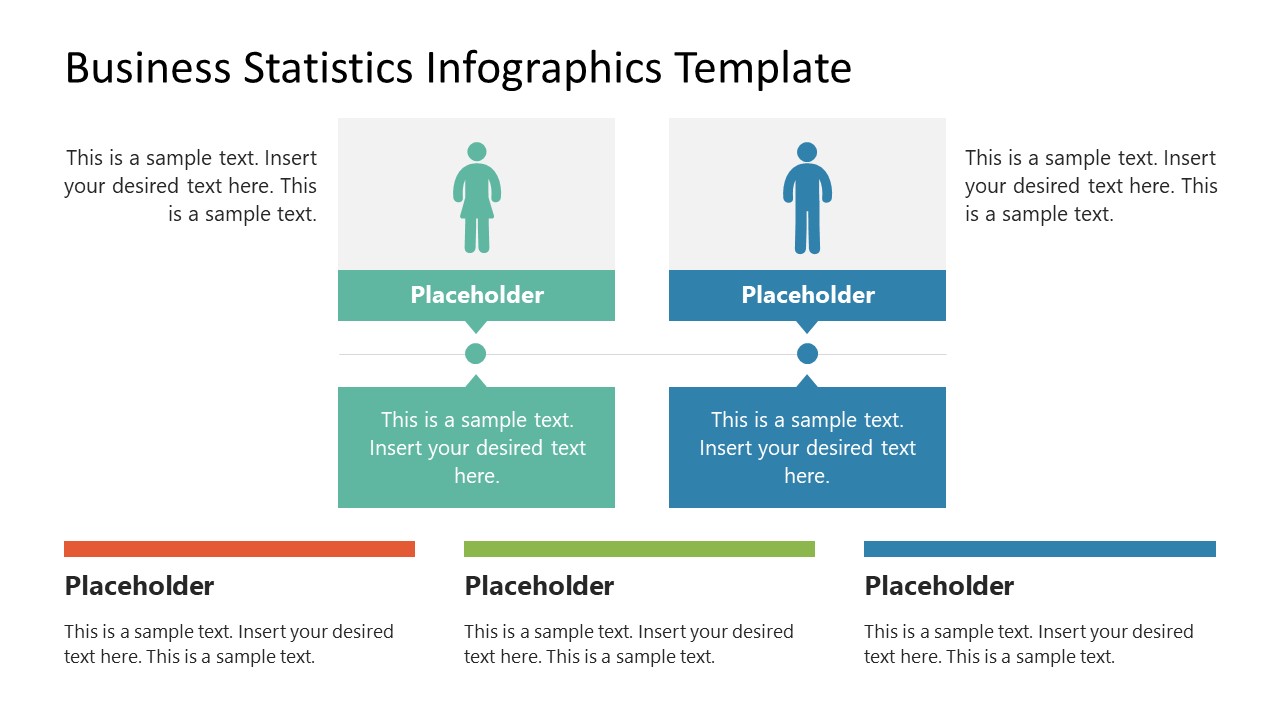
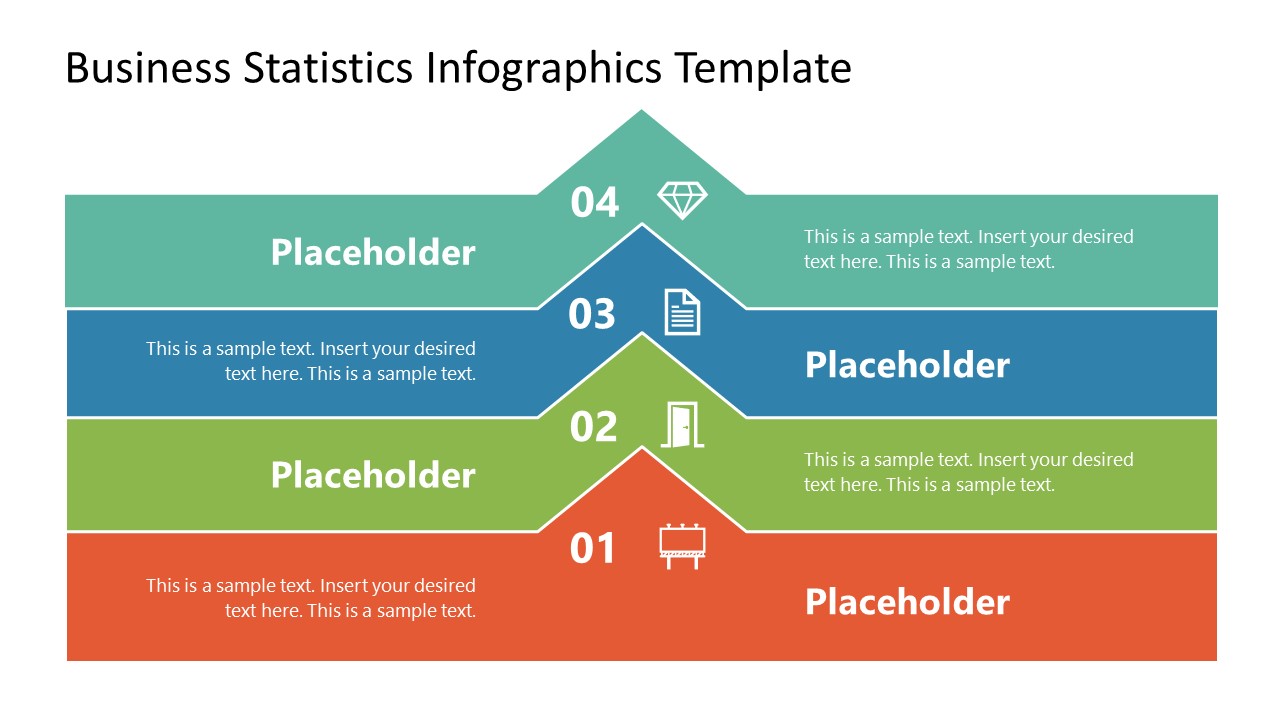
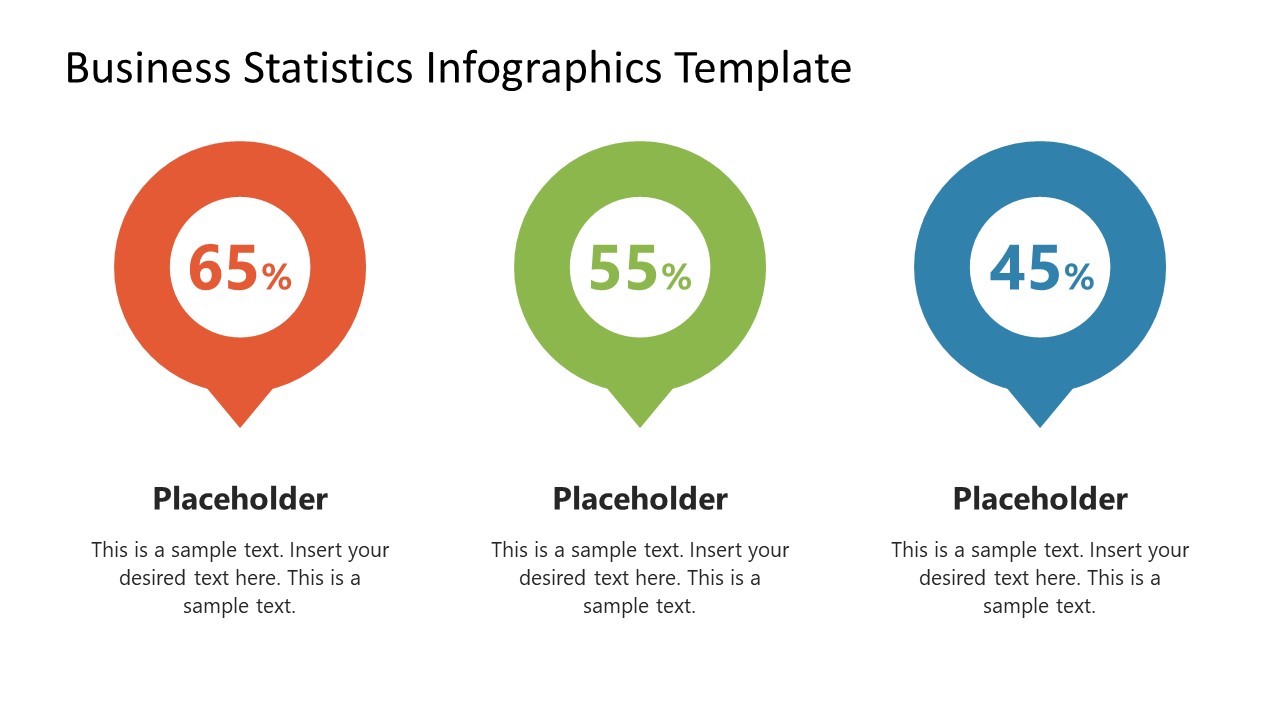
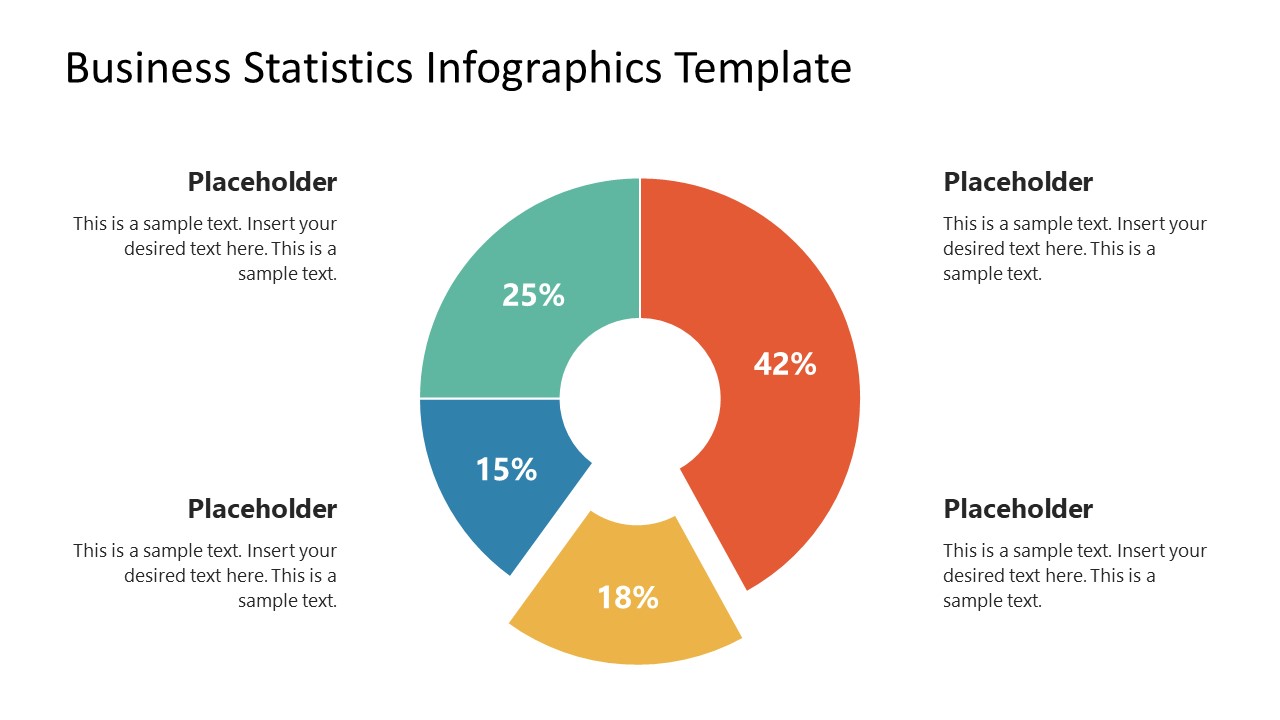
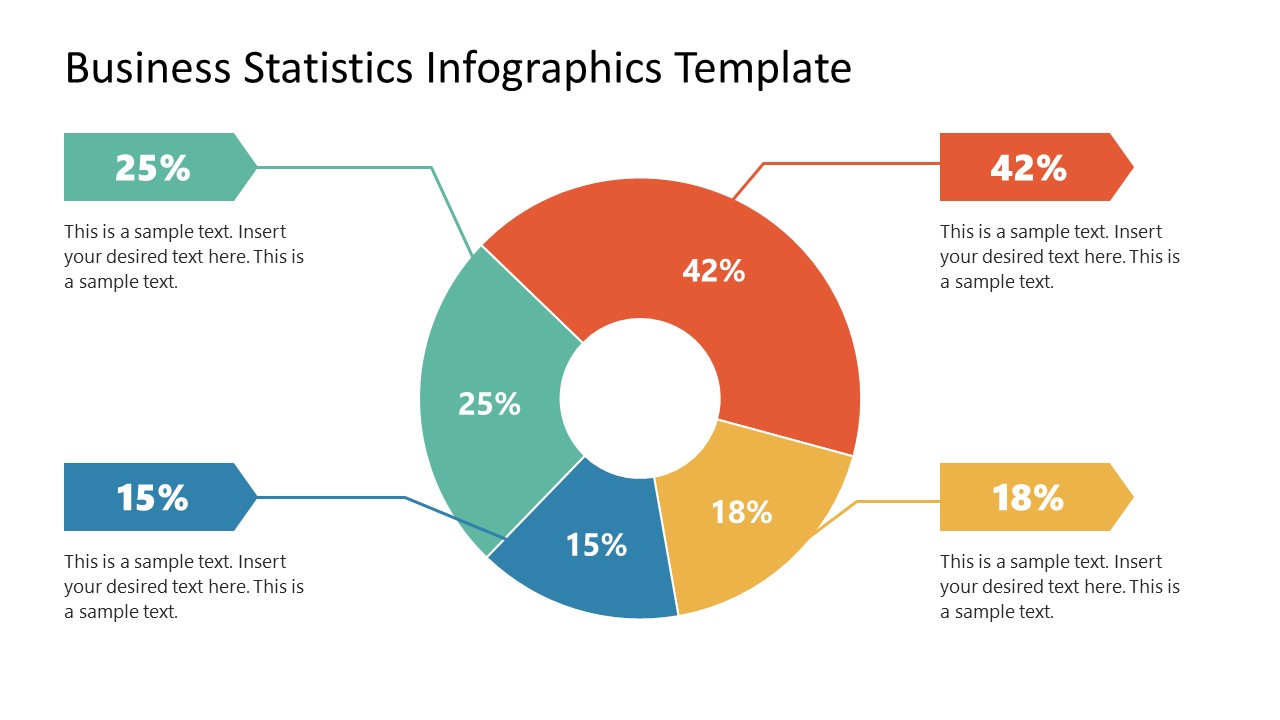
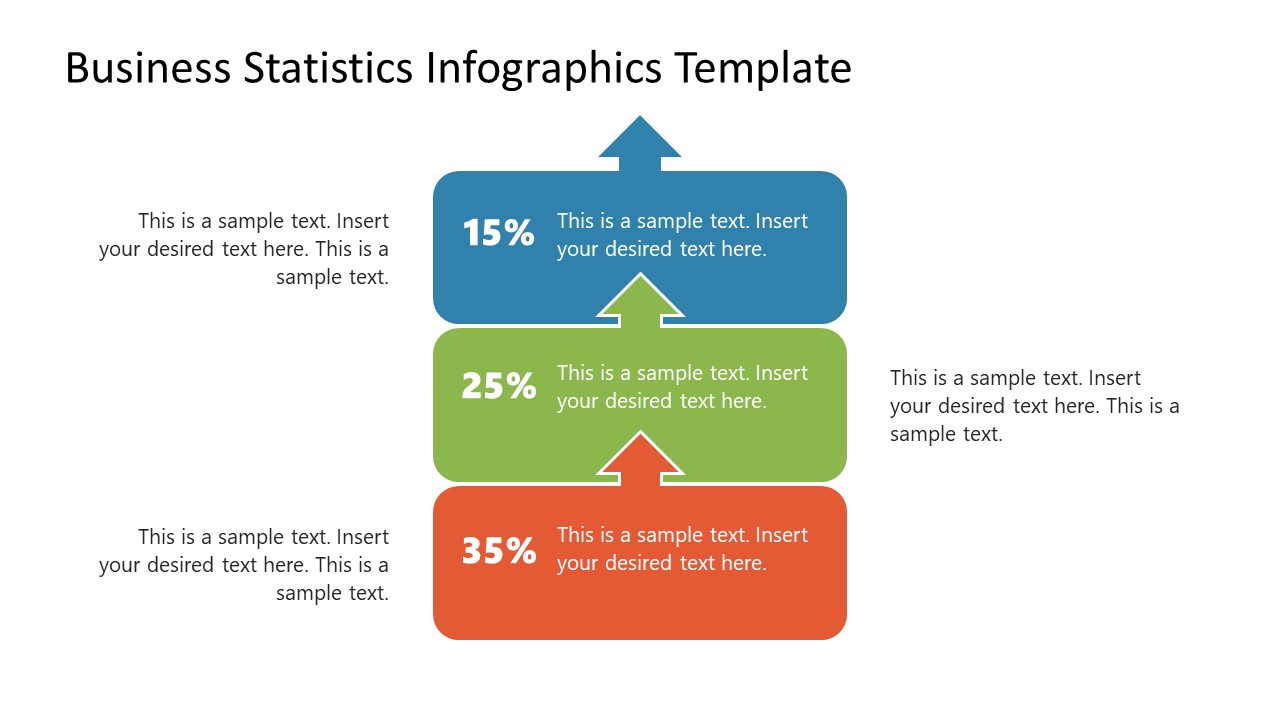
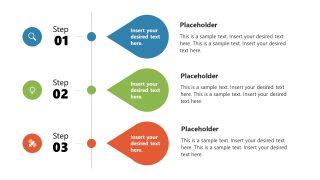
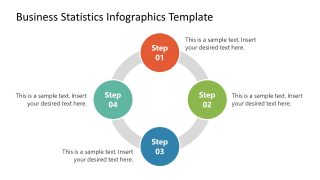
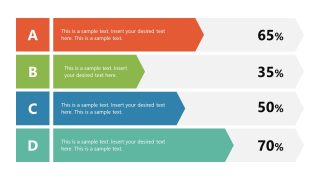
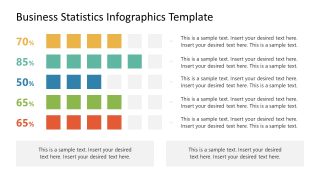
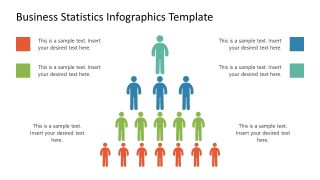
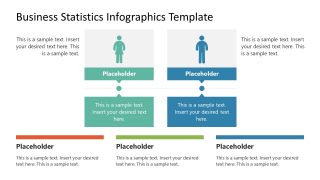
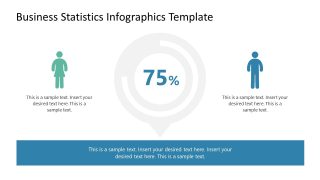
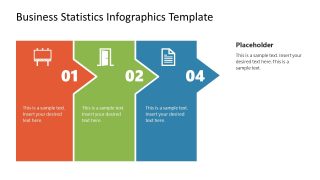
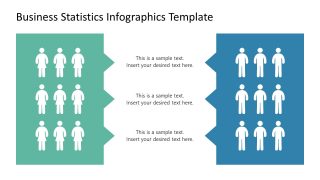
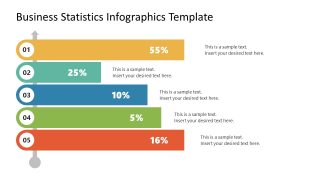
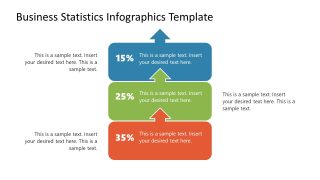
The Business Statistics Infographic Template for PowerPoint consists of 18 slides with modern and straightforward statistical infographics to visualize or present the data organizationally. The first slide shows the three-step diagram with oval shapes containing the placeholder text. In the next slide, presenters can leverage a colorful circular diagram to depict the four-step process diagram concisely. Next, we have provided horizontal bar diagrams showing the percentages in the following stats infographic slide. There are many editable textboxes in the slides to mention the brief details about the key point. You can also showcase the business processes using statistical infographic elements. Moreover, arrow shapes make timelines and process diagrams in the further statistical infographic template slides. Users can utilize these elements to describe the project phases, business ideas, and processes.
The statistics PPT template can be used in business and academic presentations to illustrate the information comprehensively. The users can change the shapes, infographic diagrams, and the number of elements provided on the statistics PowerPoint template slides. They can also repurpose the statistics slide to present the content of their choice. So, don’t wait; download this statistics Google Slides theme for your business presentations and craft your engaging statistics presentation today!


You must be logged in to download this file.
DOWNLOAD- Category
- Business PowerPoint Templates
- Rating

 Loading...
- Size
- 16x9
- Item ID
- 22198-01
- Colors
Subscribe today and get immediate
access to download our PowerPoint templates.