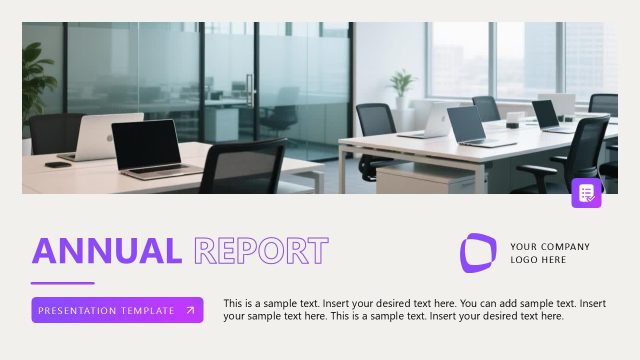
Professional Report Infographics PowerPoint Template
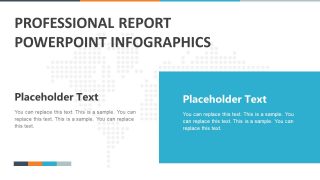
The Professional Report Infographics PowerPoint Template is a sophisticated layout of business presentations. It contains number of creative slides of infographics, data charts, and diagrams. The professional PowerPoint design is resourceful presentation tool for companies, to demonstrate their periodic progress. For instance, the comprehensive annual reports of company’s activities in the preceding year. The annual report of the business allows all the stakeholders to make important decisions based on their performance. The professional PowerPoint layout of the report has plain white background theme. This way, users can copy relevant slides to their main presentation. The slides will automatically adapt to the destination theme. However, the users can still choose the original source formatting option while pasting.
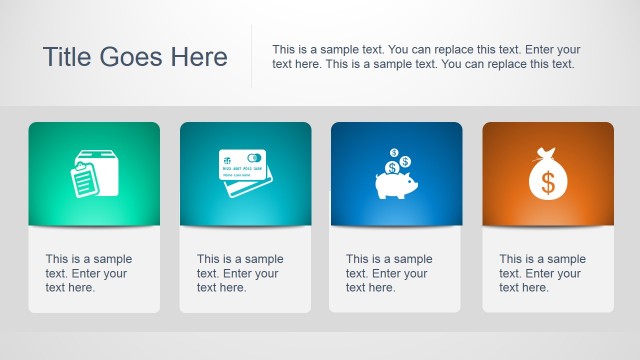
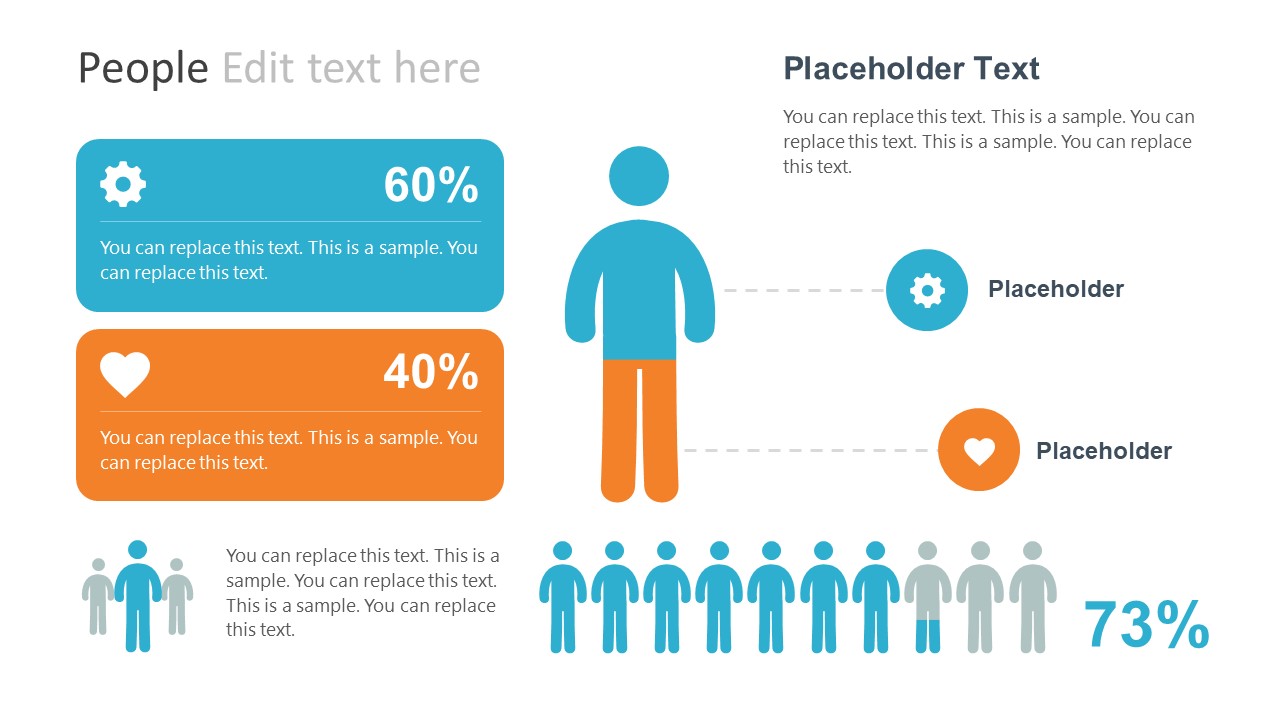
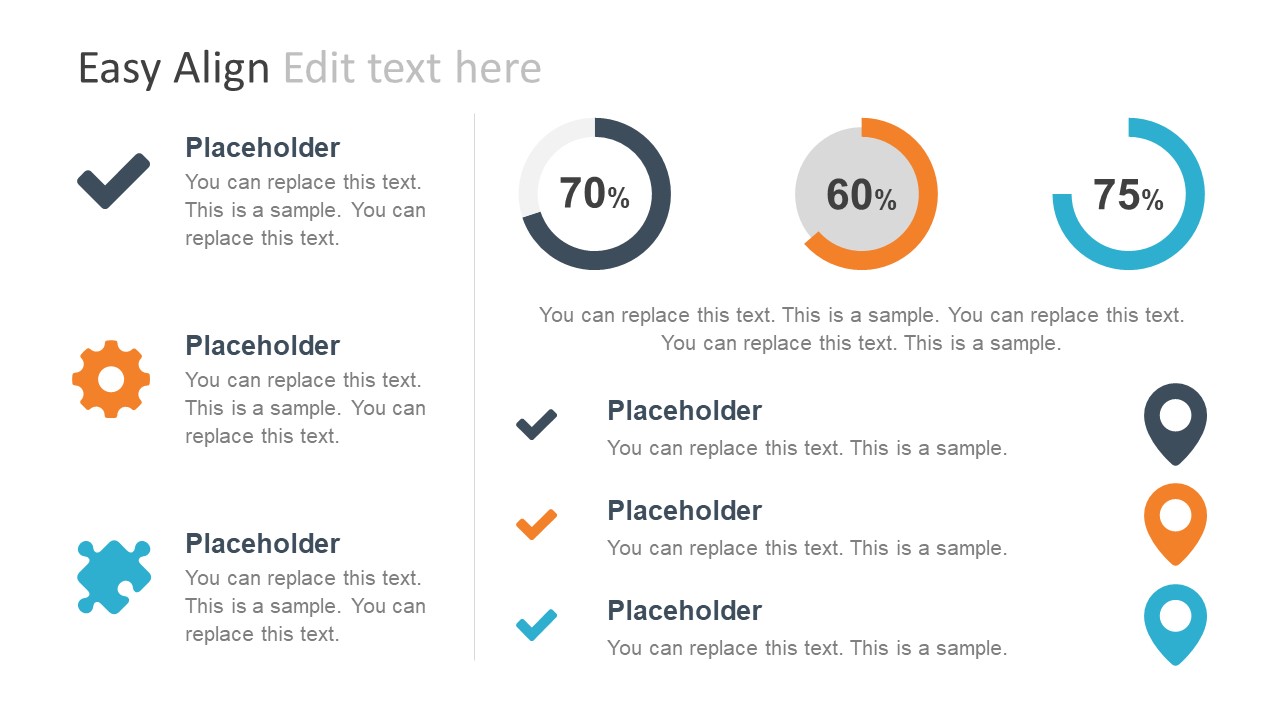
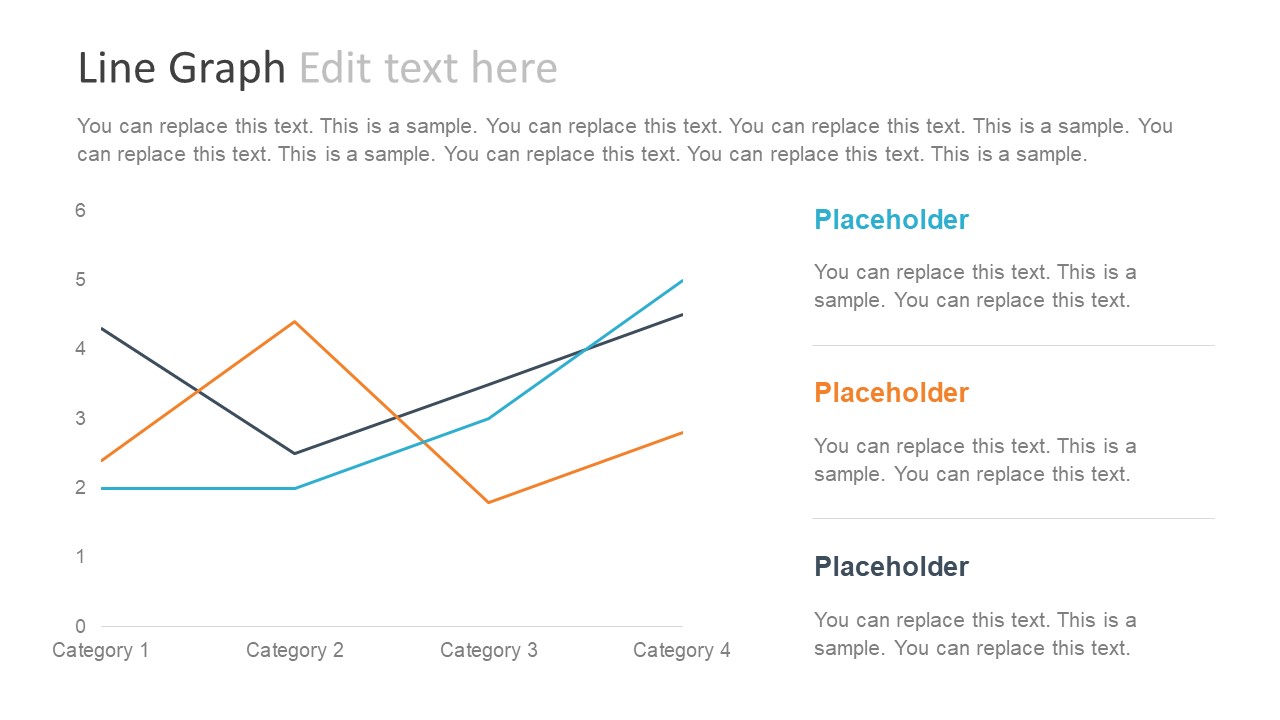
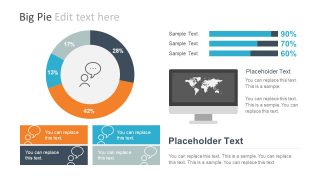
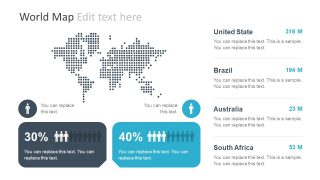
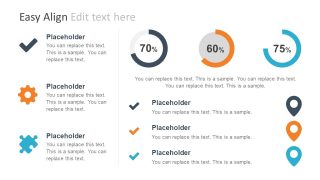
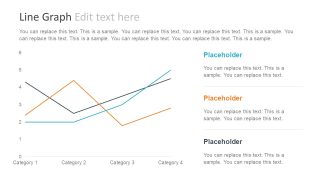
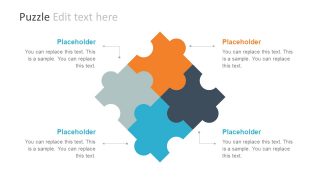
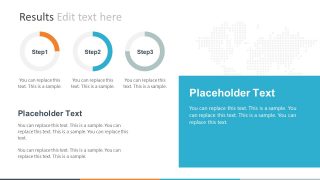
The Professional Report Infographics PowerPoint Template has nine slides of amazing charts and diagram. These include doughnut graphs, progress bars, population statistics designs, and line graphs. Further, the template of infographics has 4 step PowerPoint diagram and more interesting clip arts. Additionally, the professional PowerPoint infographics assist a user to update the diagrams and graphs. Such as the puzzle, gear, and GPS marker icons are usable objects. This can help presenters create and customize professional report slides. The 9-slide infographics PowerPoint of reports show some brilliant data-driven doughnut charts and line graph. The use of these data-driven graphs makes formatting a lot easier and quicker for business professionals. Hence the infographics in PowerPoint are the time-saving templates for businesses.
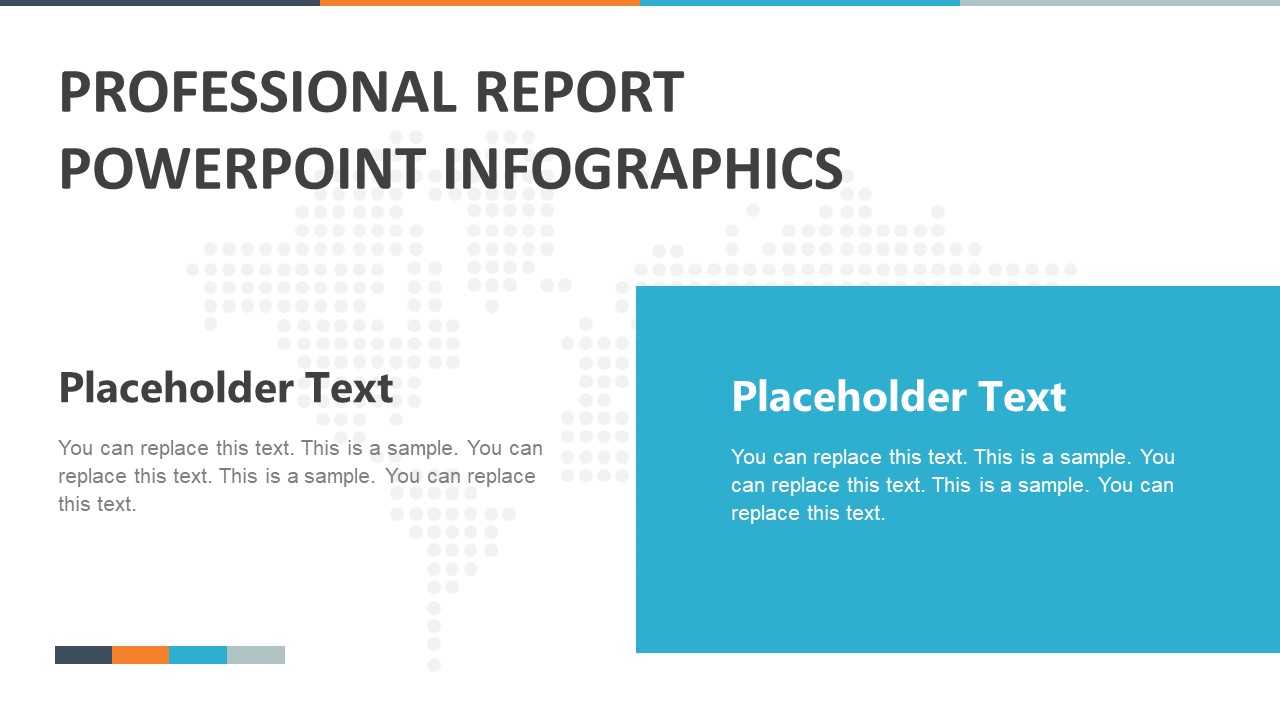
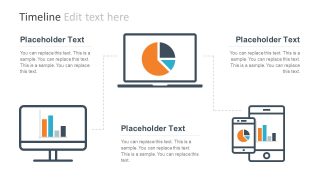
The infographics for PowerPoint in professional reports is ideal for visually demonstrating company’s KPIs. Such as the resource progress and financial indicators reporting. The use of infographic metaphors like earth map, computing devices aid deliver main agenda and key concepts. Although it is a neat presentation of white background theme. The users can change it through background format option in design menu. Also, check our collection of progress report PowerPoint templates.


You must be logged in to download this file.
DOWNLOAD- Category
- Business PowerPoint Templates
- Rating


 Loading...
- Size
- 16x9
- Item ID
- 7765-01
- Colors
Subscribe today and get immediate
access to download our PowerPoint templates.