Bowman Strategy Clock PowerPoint Diagram is a professional PowerPoint Presentation Template featuring the popular Strategy Tool Bowman’s Strategy Clock.
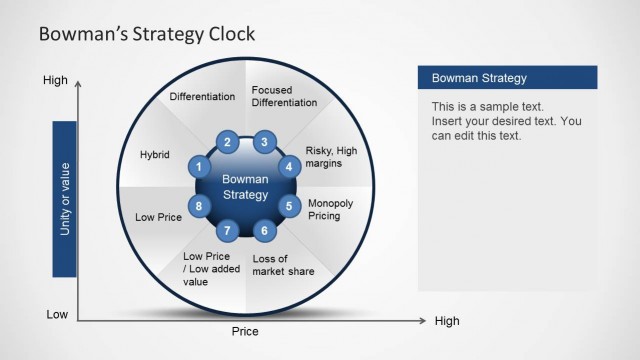
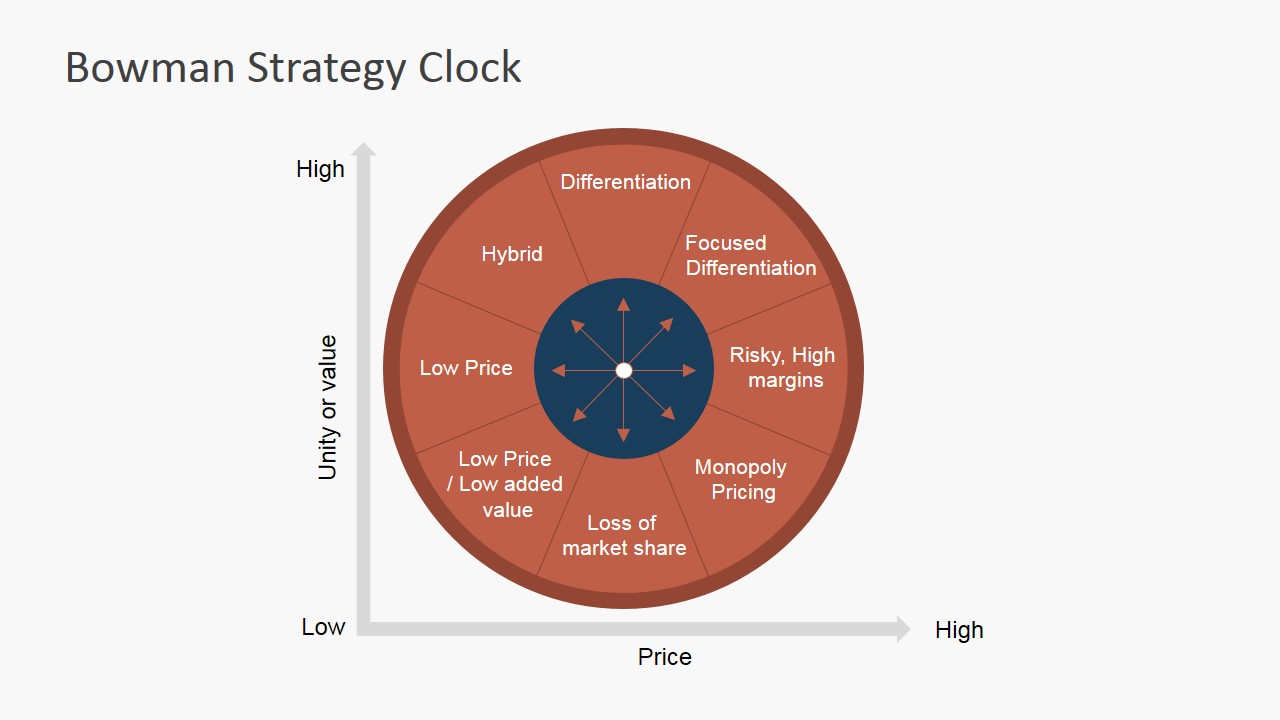
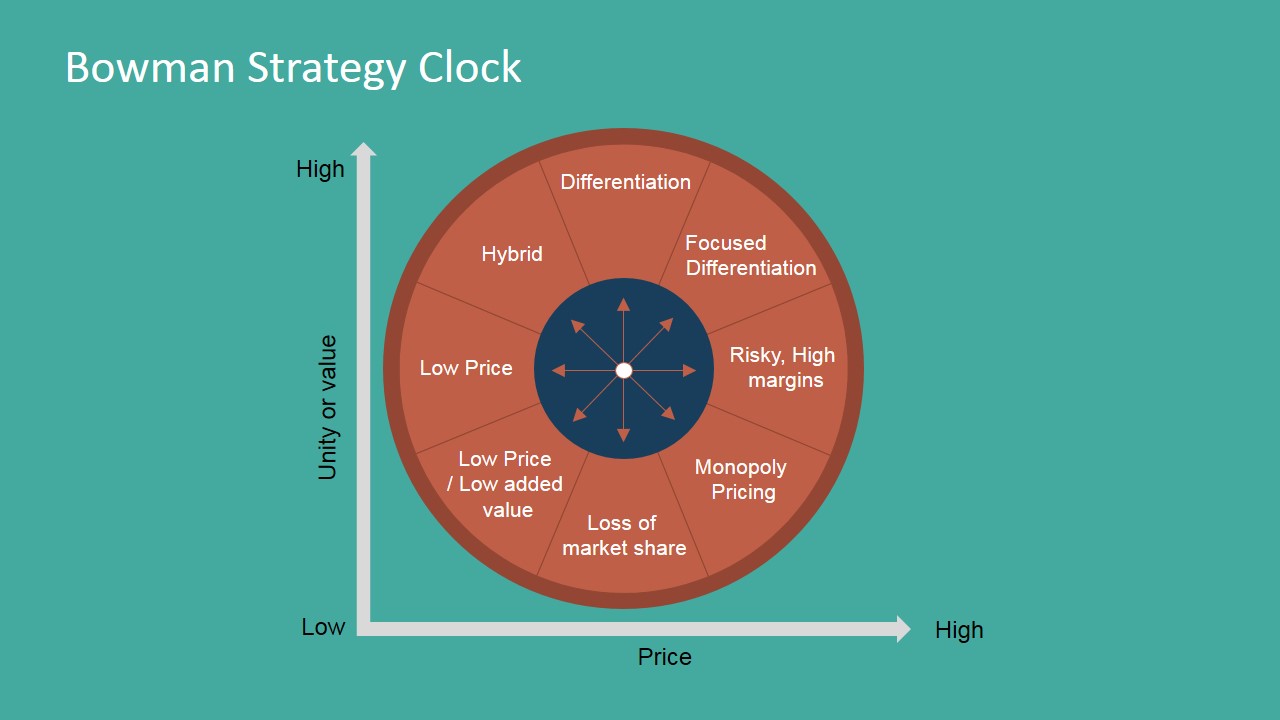
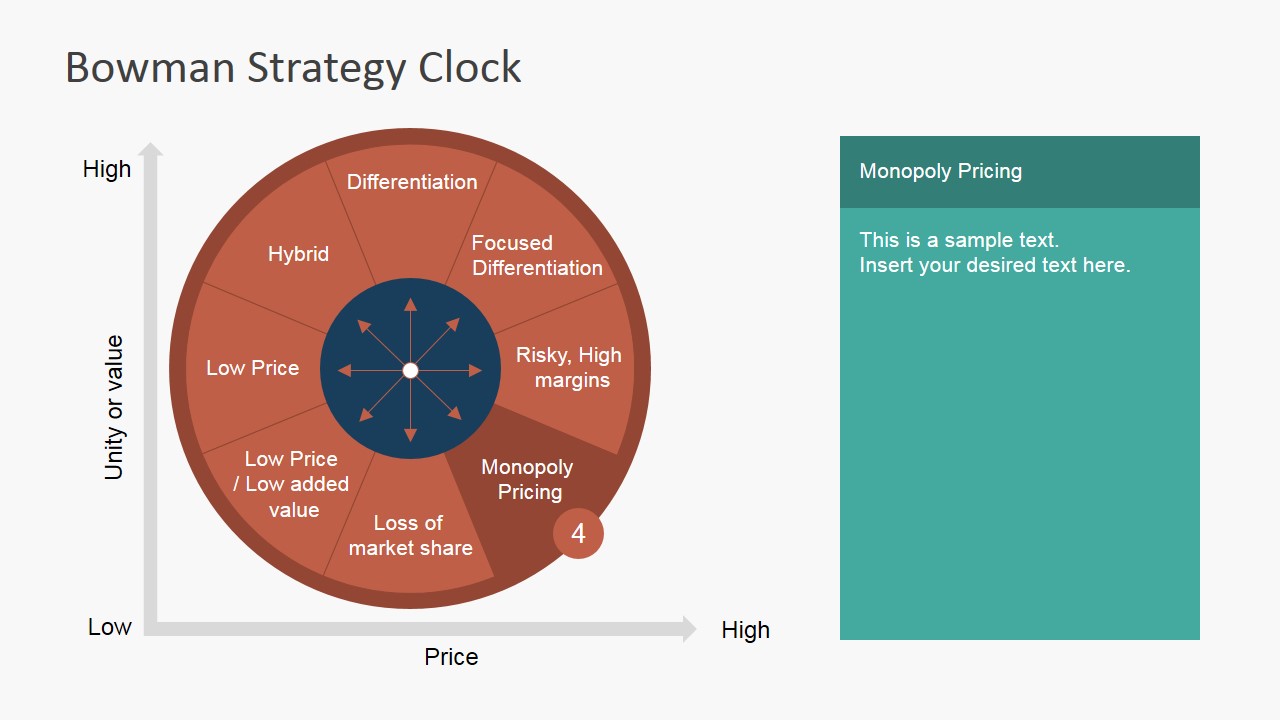
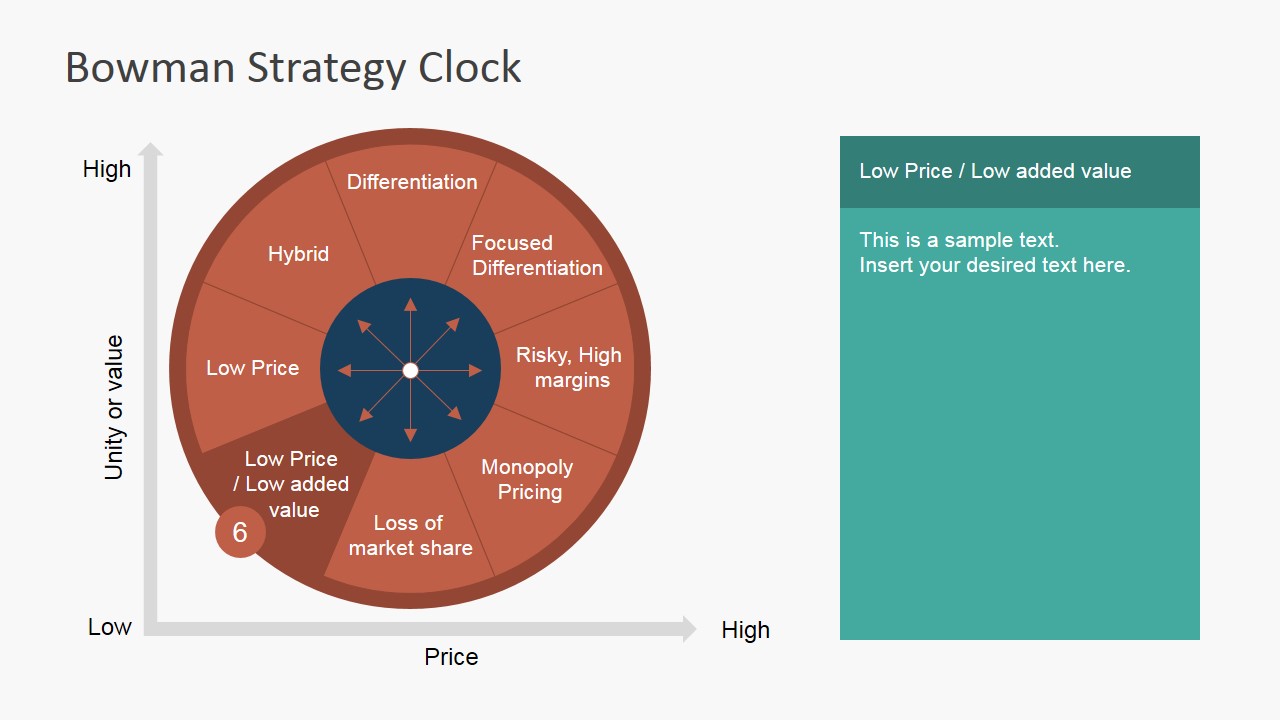
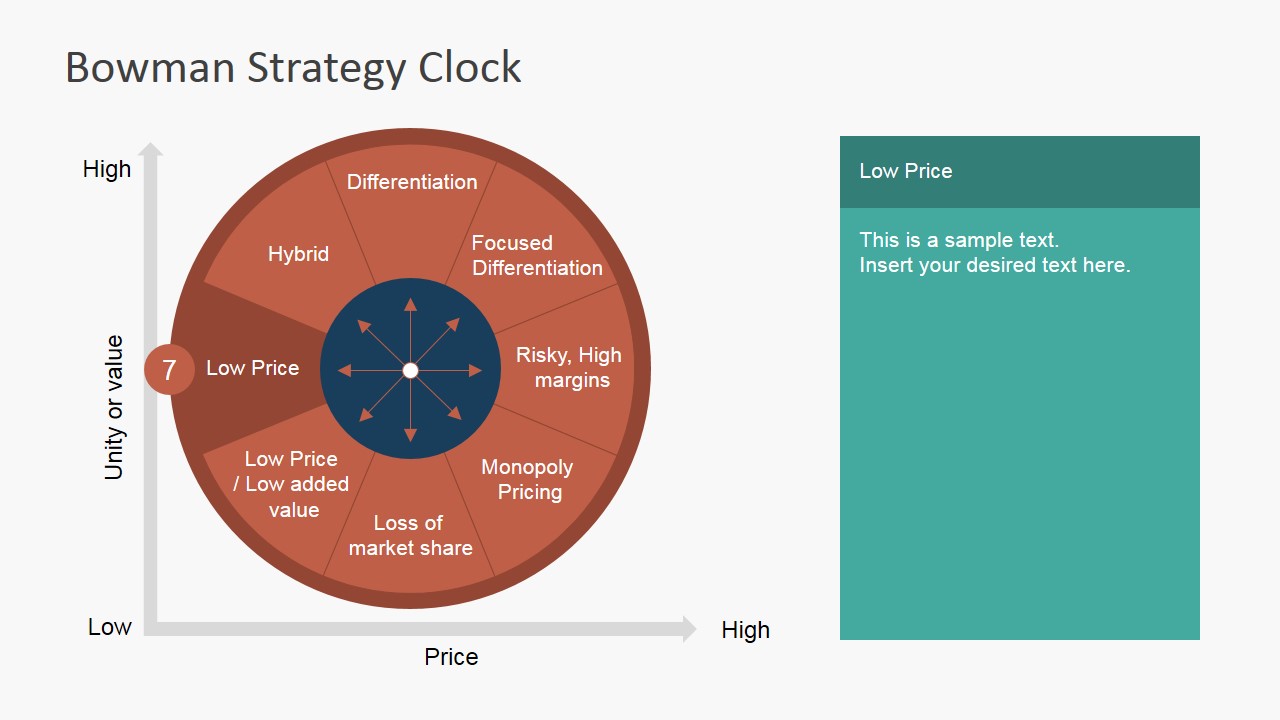
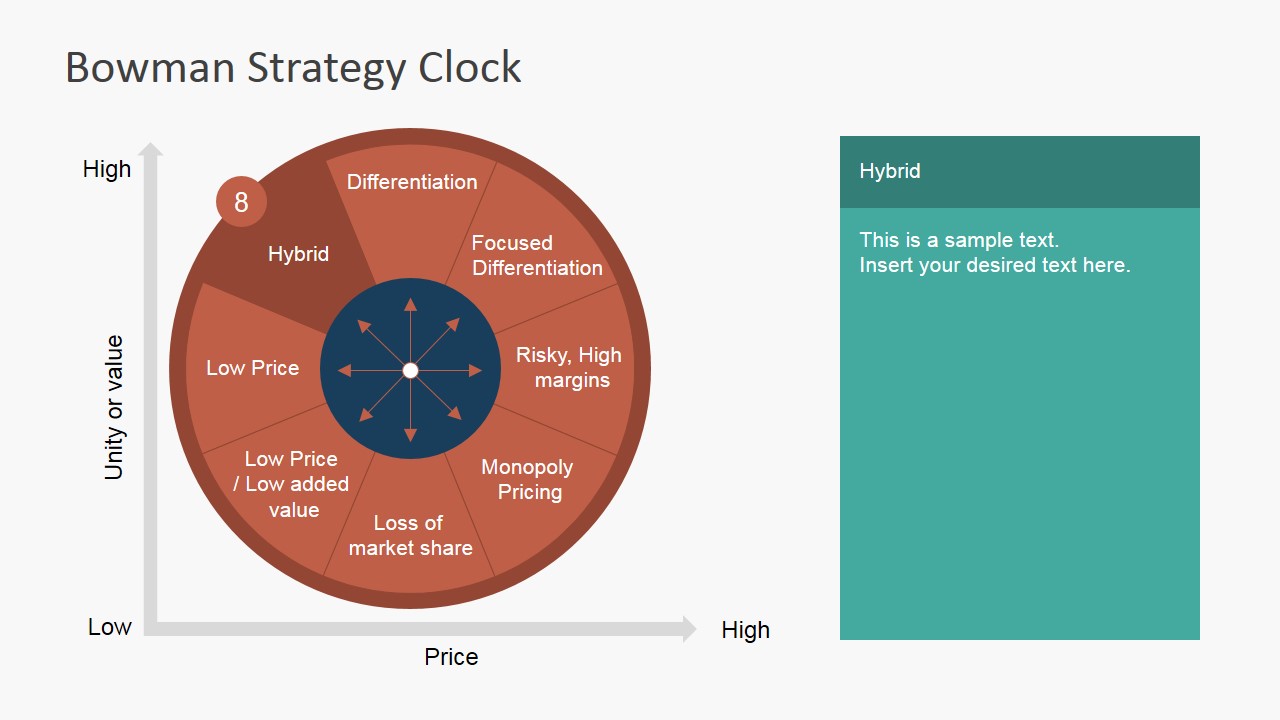
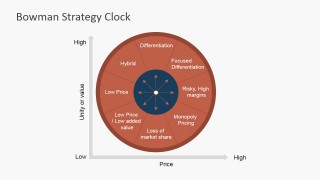
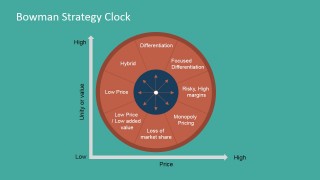
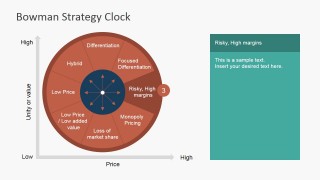
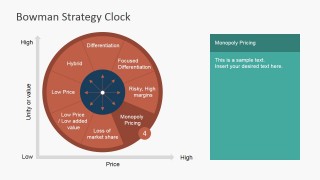
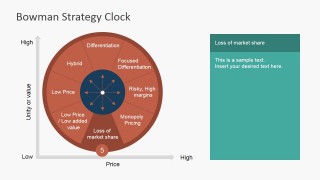
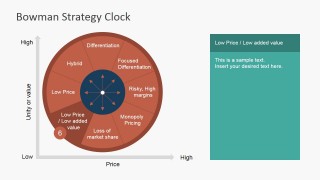
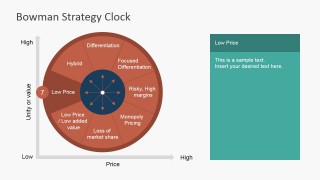
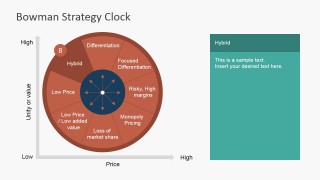
The Bowman’s Strategy Clock Model is generally used in Marketing to categorize and describe the competitive position of a company or organization, compared amongst its competitors. Developed by Cliff Bowman as an interpretation of Porter’s generic Strategies, he considers competitive advantages related to cost advantage or differentiation. The Strategy Clock of Bowman is composed as eight strategies that can be mapped across a cartesian axis, where the horizontal axis represents price and the vertical axis represents perceived value. The Resulting shape is similar to a clock.
The Competitive Strategy positions described by Bowman are:
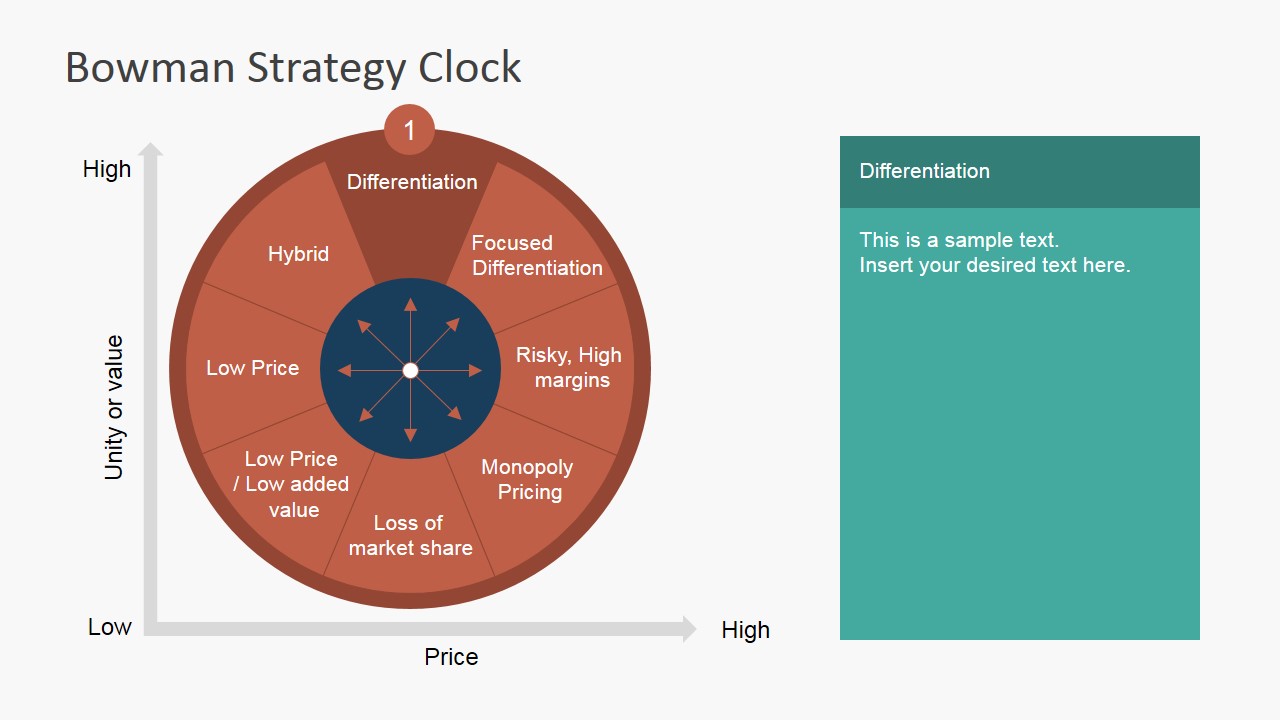
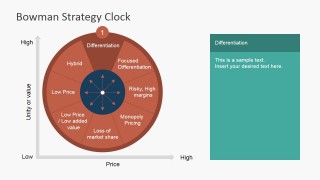
- Differentiation
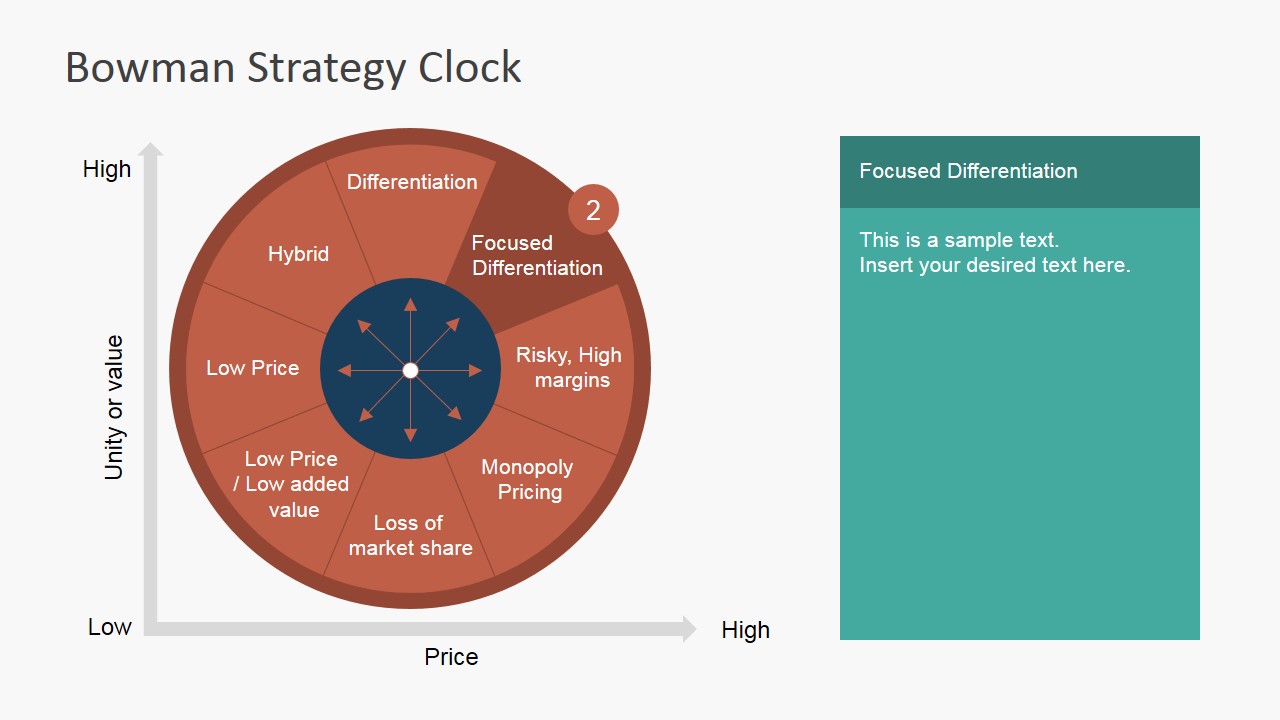
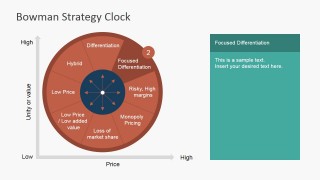
- Focused Differentiation
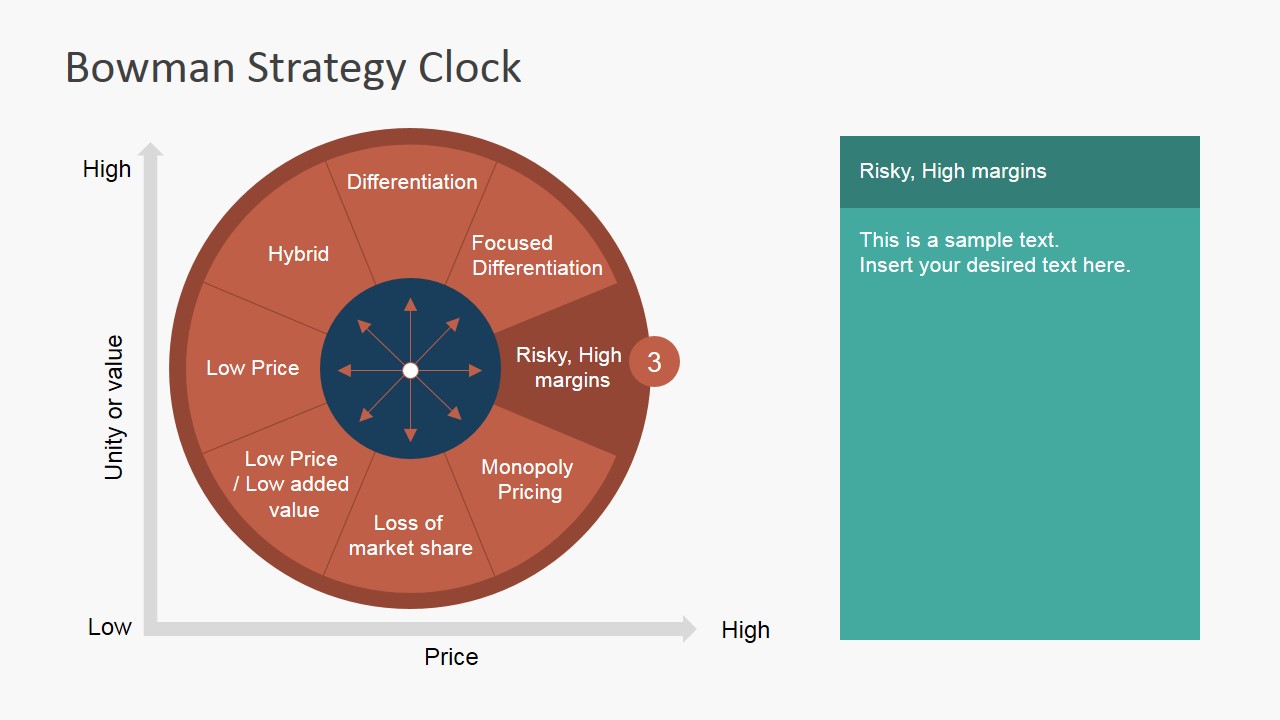
- Risky, High Margins
- Monopoly Pricing
- Loss of Market Share
- Low Priced / Low Added Value
- Low Price
- Hybrid
During the Bowman’s Strategy Clock Analysis the questions that need to be asked in order to identify which strategy to pursue are as follow:
If the organization’s competitive advantages are related to price:
- Is your organization a price leader?
- Is your organization ready to sustain a cost leadership position? This means the ability of cost management and margins control.
- Is your organization able to take advantage of all the cost reductions available?
- Does your organization balance low cost and value perception appropriately?
- YOur organization cost advantage is limited to a specific segment or it can be scaled to multiple segments ? Are these segments capable of sustaining your business?
If the organization under analysis intends to compete based on perceived value:
- Does the organization has their target markets identified?
- The organization measures the target market value ?
- Is the organization aware of the perceived value of competitors products/services ?
- Are there areas of differentiation that the organization can capitalize as a competitive advantage against other organizations?
- If actual competitive advantages are replicated by competition, does the organization has other differentiation factors ?
After answering this set of questions, Strategy Analysts can describe the competitive positioning the organization should pursue.
The Bowman Strategy Clock PowerPoint Diagram is 100% editable. It provides adequate placeholders for users to adapt the diagram to their analysis, as well as reusing diagram sections in existing presentations. Create professional Competitive Strategy Analysis that appeals to executive audiences.
What’s inside this template
Example presentation scenarios
- A strategy consultant can use the clock diagram to compare a client's price and perceived value position against market alternatives during an executive workshop.
- A marketing manager can present the highlighted strategy position slides to explain whether the brand is competing through differentiation, low price, or a hybrid approach.
- A product manager can use the side-panel slides to document implications for pricing, feature investment, and target segments while keeping the clock visible.
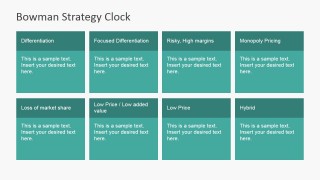
- A leadership team can use the eight-tile summary grid to review all Bowman positions before deciding which competitive path needs deeper analysis.
Features
- 100% editable presentation template
- Compatible with Microsoft PowerPoint and Google Slides
- 16:9 aspect ratio slides
- Scalable vector shapes, icons and illustrations
- AI-Ready for Microsoft Copilot and Claude
- Instant access and download
Frequently asked questions
Q: How should a presenter explain the Bowman Strategy Clock without overwhelming the audience?
A: Start with the full clock diagram and define the two axes first: price and utility or value. Then move through the highlighted position slides only for the strategies relevant to the decision. Use the side text panel to state one insight, one risk, and one implication per position so the model stays practical.
Q: Who is this template best suited for in a strategy presentation?
A: It fits presenters who need to compare competitive positions rather than report financial results. Strategy consultants, marketing leaders, product managers, and executive teams can use it to discuss differentiation, low price, monopoly pricing, hybrid positioning, and risky high-margin choices in a structured meeting.
Q: Why does the clock metaphor help communicate competitive strategy?
A: The clock layout turns abstract positioning choices into a spatial map. Audiences can see how low-price options sit apart from differentiation-led options, while adjacent segments suggest related strategic moves. The repeated highlighted slides help the presenter zoom into one position without losing the overall model.




Bowman Strategy Clock PowerPoint Diagram
12-slide strategy presentation template with Bowman Strategy Clock diagrams and competitive positioning tiles
Bowman Strategy Clock PowerPoint Diagram is a 12-slide strategy template for mapping competitive position by price and perceived value. It includes a cover, full clock diagrams, highlighted position slides, side text panels, and an eight-tile summary grid for analysts, marketers, and executives using Microsoft PowerPoint or Google Slides.
- Category
- Strategy
- Rating


 Loading...
- Aspect ratio
- 16:9, 4:3
- Item ID
- 6236-02
- Colors
 Microsoft PowerPoint
 Microsoft Copilot
 Claude for PowerPoint
Other formats supported
Subscribe today and get immediate
access to download our PowerPoint templates.