Slide 2 of 6 from 3D Growth Bar Chart for PowerPoint
6048-01-3d-growth-bar-2
3D Growth Bar Chart for PowerPoint
- Chart
- Bar Vertical
- Evaluation Slide
- 16:9
- 100% Editable
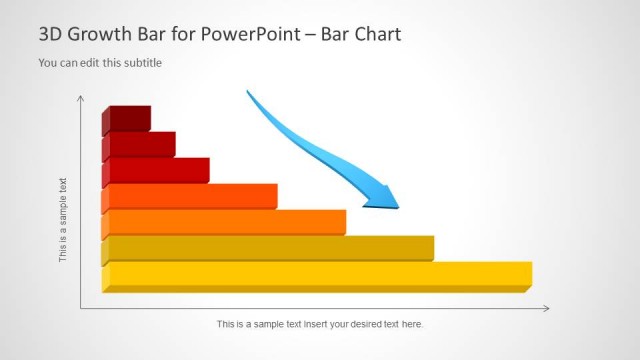
The 3D Growth Bar Chart slide from the 3D Growth Bar Chart for PowerPoint template offers a clear visual for financial performance review and market analysis reports. This slide layout features editable shapes and vector icons to highlight annual growth trends effectively, making it a practical choice for business presentations and pitch deck templates focused on revenue or market expansion.
What’s on This Slide
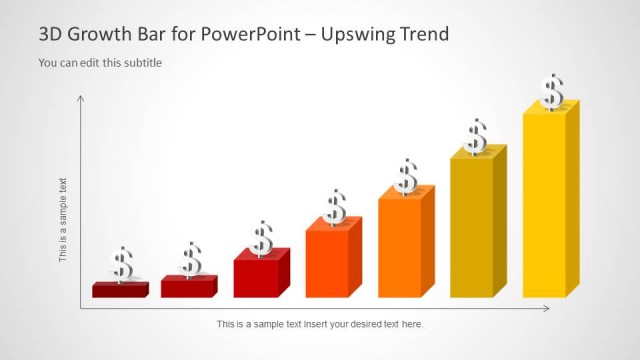
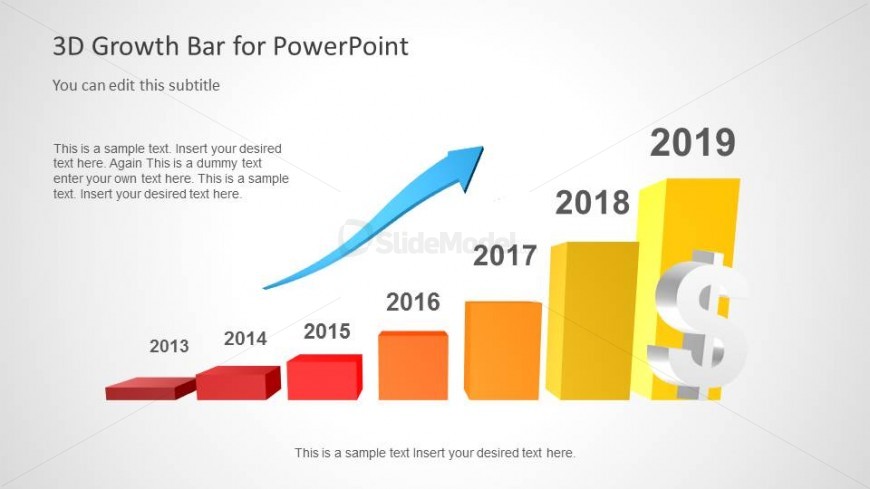
The slide features a 3D bar chart displaying growth over several years, with bars positioned horizontally across the bottom. The years 2013 to 2019 are labeled below each corresponding bar. An upward arrow indicates growth, starting from the left and moving toward the right. The bars are colored in shades of red, orange, and yellow, with the highest bar for 2019 being the largest. Text placeholders are present for the title, subtitle, and additional information, aligned to the top and center of the slide. The background is light gray, enhancing the visibility of the chart.
How to Use It
This layout serves as a visual representation of growth metrics over time, suitable for financial presentations or performance reports. It fits well after introductory slides that outline objectives or challenges, providing a clear visual of progress. This slide can be used in business contexts to illustrate revenue growth, market expansion, or project milestones, making it effective for stakeholders needing to understand trends at a glance.
Text Placeholders & Capacity
Keep your copy within these limits so it fits without resizing. Body slots can accommodate roughly 15-20 words each.
| Placeholder | Count | Max characters (approx.) |
|---|---|---|
| Slide title | 1 | 30 |
| Subtitle | 1 | 50 |
| Item heading | 7 | 4 |
| Body paragraph | 3 | 100 |
Slide Keywords
Download unlimited PowerPoint templates, charts and graphics for your presentations with our annual plan.
DOWNLOADReturn to 3D Growth Bar Chart for PowerPoint.