Slide 3 of 6 from 3D Growth Bar Chart for PowerPoint
6048-01-3d-growth-bar-3
3D Growth Bar Chart for Presentations
- Chart
- Bar Vertical
- Evaluation Slide
- 16:9
- 100% Editable
The 3D Growth Bar Chart slide from the 3D Growth Bar Chart for PowerPoint template offers a clear visual tool for financial presentations and growth analysis. This slide layout uses editable shapes and vector icons to highlight ascending performance metrics, making it suitable for business presentations and pitch deck templates focused on progress evaluation.
What’s on This Slide
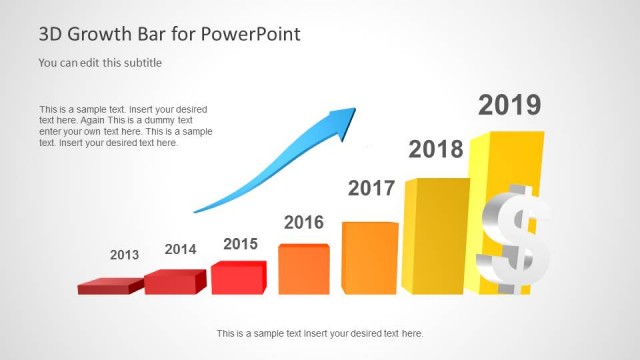
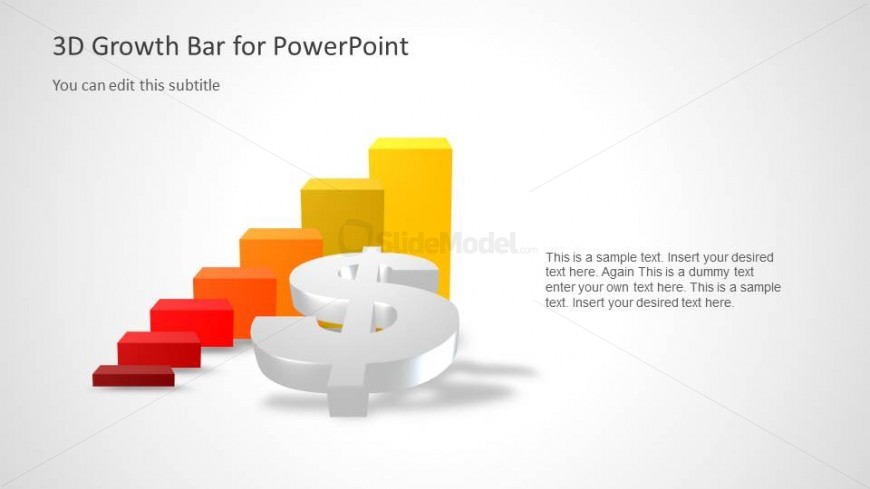
The slide features a 3D bar chart with five vertical bars in red, orange, yellow, and a prominent silver dollar sign in the foreground. The bars are arranged in ascending order from left to right, creating a visual representation of growth. Text placeholders are positioned on the left and right sides, with the title at the top left and a subtitle below it. The background is a light gradient, enhancing the visual contrast of the bars. The overall layout emphasizes the growth theme through color and structure.
How to Use It
This layout serves as a growth comparison chart, ideal for showcasing financial data or performance metrics. It fits well in a presentation sequence following introductory slides, providing a visual representation of progress over time. Use this slide to present growth trends, sales figures, or project milestones. It is suitable for business meetings, financial reports, or strategic planning sessions where visual data representation is essential.
Text Placeholders & Capacity
Keep your copy within these limits so it fits without resizing. Text slots are moderate, with body paragraphs allowing roughly 15-20 words each.
| Placeholder | Count | Max characters (approx.) |
|---|---|---|
| Slide title | 1 | 30 |
| Subtitle | 1 | 50 |
| Item body | 5 | 50 |
| Body paragraph | 3 | 100 |
Slide Keywords
Download unlimited PowerPoint templates, charts and graphics for your presentations with our annual plan.
DOWNLOADReturn to 3D Growth Bar Chart for PowerPoint.