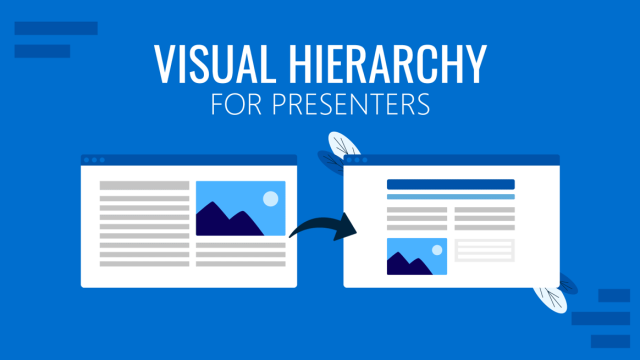
When we talk about presentation design, several elements define the reception factor from the audience. Color scheme, word density, and image quality, but overall, the initial impact is the layout of the presentation.
UX stands for User Experience, a discipline that derives from Graphic Design that studies the impact of visual elements in the interaction between users and any kind of product, service, or system. Its scope covers usability, accessibility, functionality, and also design. Since UX Designers study customers’ behavior in detail, we can find common ground with presenters; hence, we believe this topic can be of immense value to presenters seeking to elevate the quality of their presentations.
Join us today for an article on applying the Laws of UX in slide presentation design. We shall discuss the laws in detail, their benefits and disadvantages in common-day slide design, and some case studies to illustrate how to work with the laws of UX to create incredible slides. Let’s get started.
Table of Contents
- What do we mean by “Laws of UX” in Presentations?
- How different is applying the Laws of UX to presentation design compared to Web Design and Graphic Design projects?
- Benefits of using the Laws of UX in presentation design
- Disadvantages of using the Laws of UX in presentation design
- 17 Laws of UX to Master
- Tools to apply the Laws of UX in presentations
- Conclusion
What do we mean by “Laws of UX” in Presentations?
As previously stated, the Laws of UX are a set of principles and guidelines intended to create an engaging and effective user experience in multiple streams of products, services, or systems. This can fit product design, mobile application design, web design, and also graphic design projects.
When we speak about the context of presentations, we imply applying these UX laws to guide the slide design process, helping us define layout, text density, text or image hierarchy, and use of color or typography, among other visual aids to deliver our message better. Presenters should see the final aim of using the laws of UX as an aesthetical factor and a toolset for building remarkable communication mediums.
How different is applying the Laws of UX to presentation design compared to Web Design and Graphic Design projects?
In general, applying the laws of UX works similarly for either presentation design to web design, particularly graphic design – as presentation templates are usually by-products of graphic designers. There are, although, some differences we need to mention.
We can assume presentations to be a live medium, as there’s a continuous exchange between the presenter and the audience, with the slides becoming the tool that helps to forge that medium. In presentations, audience engagement and timing are vital elements the presenter has to structure, accompanied by the graphical elements introduced. The slides respond to the presenter’s speaking style, and even if the design is stellar, the overall response from the audience is negative in case the speaker lacks the required presentation skills for the topic. On the other hand, graphic design projects have a more restrictive application of the laws of UX, since the impact is easily perceived than what would happen with a slide design.
Regarding interactivity, there are considerable differences between applying the laws of UX for web design and presentation slides. Web elements are interactive; they allow the users to experience content in multiple formats, navigating according to their will and remaining on a website for as much as they like. Presentations are structured by the kind of event that hosts it, which limits the permanence they have, the capabilities of “users” (in this case, attendees) to navigate the presentation in a different format, and labeling the user as a mere spectator who may or may not have time to ask questions about unclear points. This means presenters control how content is distributed, whereas, in web design, the user controls how to access the content with their interactions.
Benefits of using the Laws of UX in presentation design
Content Experience
The primary benefit of applying the laws of UX to presentations is crafting user-friendly content that intuitively guides the spectator. Content can be easily understood, and some of the guidelines in this article are ideal for breaking apart complex concepts into digestible knowledge.
Driving Engagement
As we learn to structure the graphical elements according to psychology and clearly understand our audience, the presentations move from common pieces of knowledge to attention-grabbers for the spectators. This concept is linked with increasing the retention rate of the content presented, and when paired with a proper sales psychology strategy, it can convert prospects into buyers.
Persuasion and Credibility
Two key ingredients in topics like sales pitches, investor meetings, or any topic involving a huge deal of emotional input. Presenters can create slides that resonate with the audience’s core beliefs and values using the teachings from these laws.
On the other hand, if you need to display expertise in a field, it is not enough with the content of your speech; your presentation slides have to be in pair with the credibility you aim to project. No one would buy a product if the presentation format does not meet certain quality standards regarding graphics, so master these techniques to bring that extra ingredient to the table.
Accessibility
Feeling concerned about how attendees with disabilities perceive the content you create is a natural part of becoming a master presenter. You can add closed captions, work with better contrast, and include audio recordings in your presentations. Still, if the content strategy doesn’t mix those elements, they feel like additions rather than a planned intent to reach all your target users. Using the laws of UX wisely can bring cohesion to different media actors in one presentation design.
Disadvantages of using the Laws of UX in presentation design
Learning Curve
There is no secret that more than half of the laws explained in this article require time and practice to be learned, even more to define your skills within the “mastery” zone. For users who lack a background in graphic design, UX guidelines may feel challenging, but take one step at a time with the vast amount of learning resources we can come across over the internet.
Time-Consuming
For those working in a rush to deliver a presentation within the next hour, UX laws may bring little sense to the table if you’re still deciding on which content to include. Working with these guidances requires time, expertise, and practice to feel comfortable editing content into new formats.
Our recommendation is to start with a step-by-step implementation. Work with one law or two, those that are more relevant to the work you produce. Take care of any details until the application of said laws become natural.
Inducing Complexity
What could be displayed in 2-3 slides can become an immense slide deck as you aim to cover all possible details from your presentation. Extracting each and every aspect of your ideas is not a wise approach to presentation design, as being concise matters more than showing how much knowledge you bear on a topic. This is the core reason why new users applying the laws of UX may feel as if they are over-complicating content rather than showcasing clear ideas – and that can be as overwhelming in terms of graphics as it is with disorganized speech.
It May Limit Creativity
Research by the British Psychology Society discusses the detrimental effect of perfectionism on creativity. Getting your workflow around the laws of UX and only feeling content is “acceptable” after it complies with their guidelines is the best method to kill your creative persona. Be reasonable. Set limits to where you wish to apply the teachings of these laws, whereas you should be practical and, why not, unconventional to work with the “wow factor” in front of your audience.
17 Laws of UX to Master
We reached the core section of this article, where we shall expose one by one the different UX laws that can make a significance in presentation design.
Hick’s Law
This law, also known as the Hick-Hyman law, describes the relationship between the time it takes for a person to make a decision with the number of options presented. William Edmund Hick and Ray Hyman, the psychologists who created this theory, examined the reaction time of a person in reaction to the stimuli present on the scene, observing that there was a logarithmic increase in the reaction time depending on an increased number of options – often being more than what the model required. There is a counterpart, and this is when restricting the options hinders the pre-conceived idea by the user, as none of the options match their initial approach. In such a case, it can lead to decision paralysis until a new perspective is introduced that re-writes that learning path.
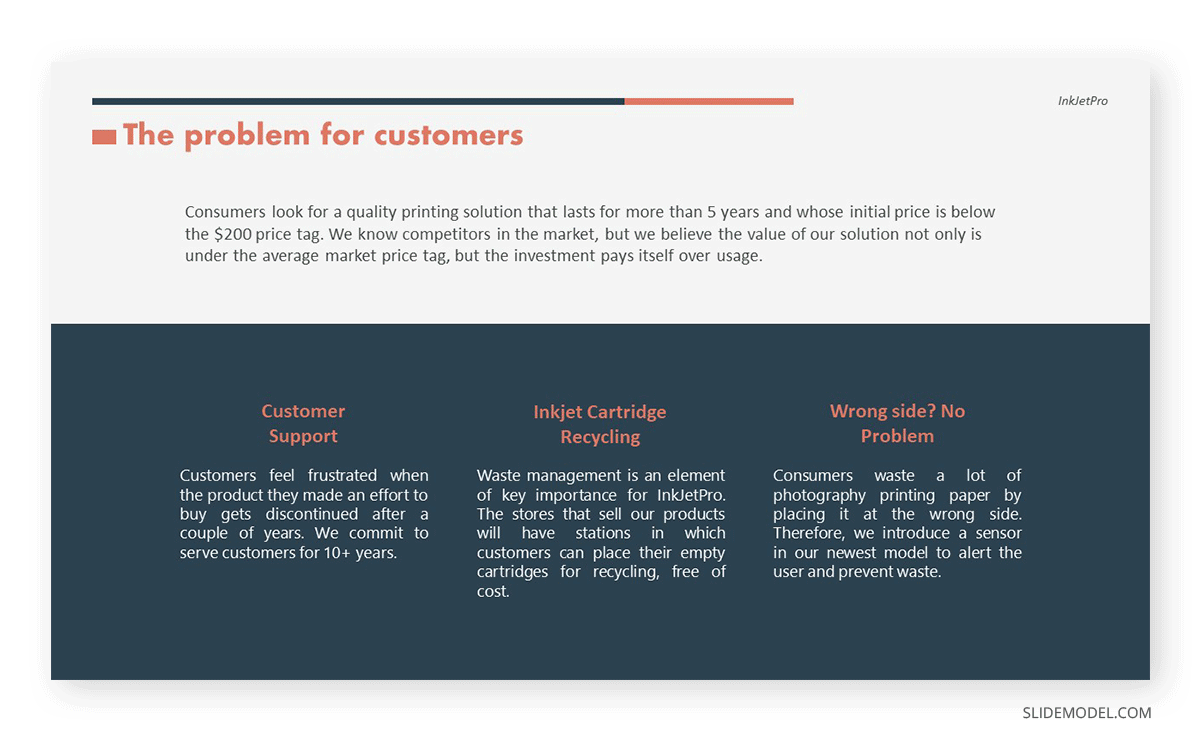
Therefore, how does Hick’s Law influence presentation design? The answer to this question is to work with simple and uncluttered slides. Only the relevant information to present should be contained per slide, not fitting as many elements as possible, which is a common bad practice in presentation design. Avoid the decision fatigue factor by limiting the content you list per slide since that helps the audience to focus only on what’s relevant to your speech.

Fitt’s Law
The second law to approach is Fitt’s Law, named after its creator, American psychologist Paul Fitts. This law states the relationship between the time required to move a pointing device, the target size, and the distance from the starting point. In short, a larger target placed closer to the starting point takes less time to reach than smaller targets placed at a distance. Therefore, how does this apply to PPT presentations?
Since this is one of the main principles used to measure the efficiency of graphic interfaces and improve usability, the same ideas apply to presentation design when we work under these premises:
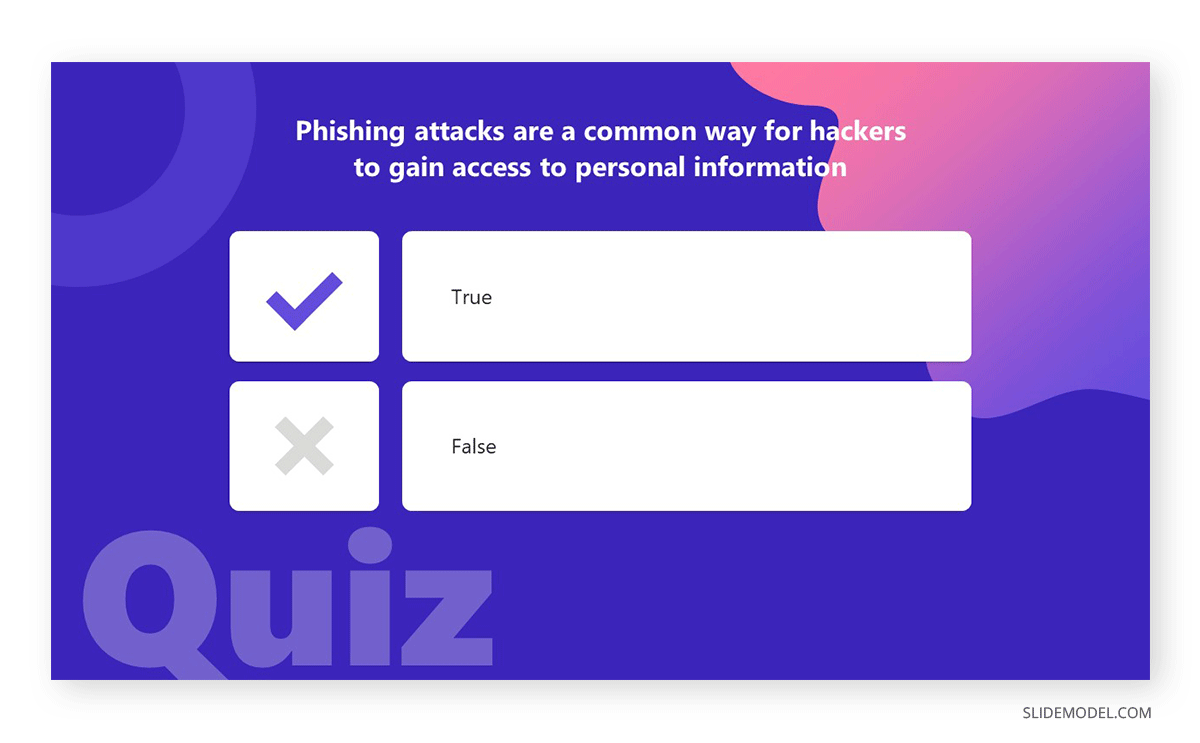
- For interactive presentations, like those containing quizzes, clickable elements such as buttons should be placed in a size bigger than their placeholder text area. The reason behind this is to make the element stand out in the slide, making it easier to navigate.
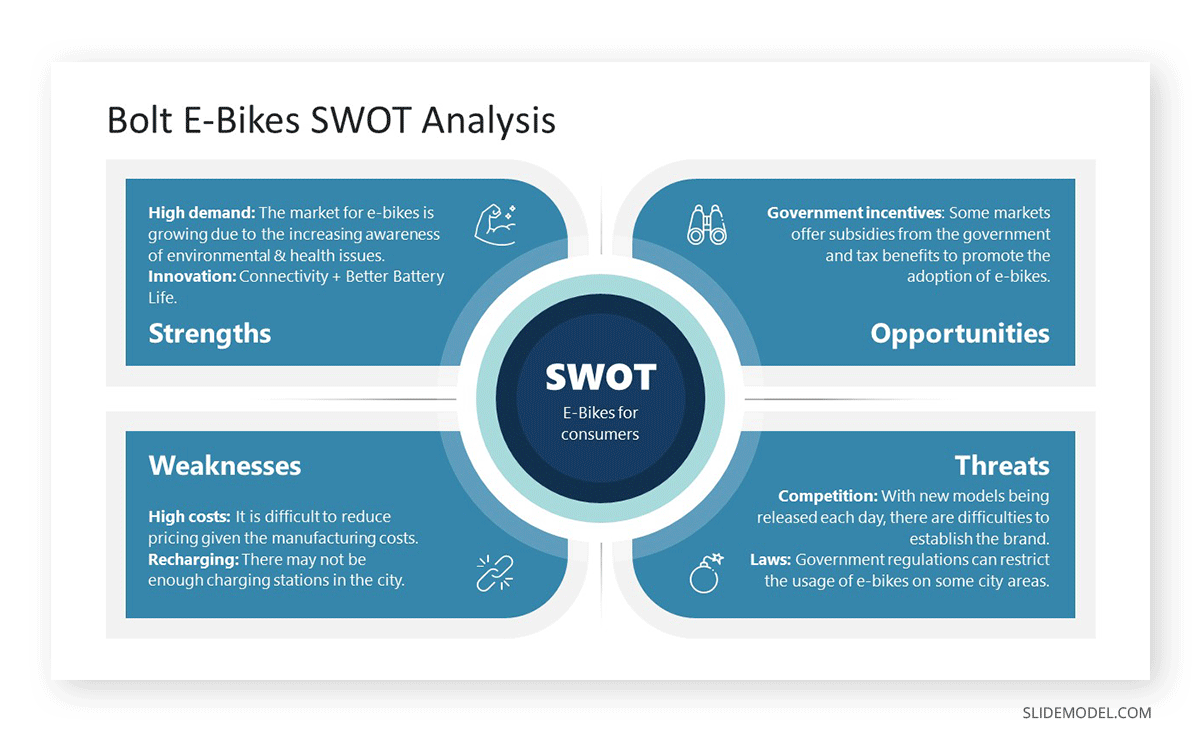
- Creating columns like menus in slide decks helps give the audience a cohesive message about the content shared, focusing the attention on the concepts explained per slide but giving a full picture of which point is being discussed in relationship with the main topic for the presentation.
- By grouping elements like texts and images, the audience gets a clearer idea of the relationship between those elements, reducing the time span required to drift the attention from one point to another.
- When choosing your color scheme for the presentation, opt for a consistent color palette to enhance readability. Monochromatic schemes work like a wonder for presentations that must include lengthy text boxes. We can use one color to highlight the slide’s title, another to define the section’s color and a third one for the placeholder areas for texts or images. A scheme like this ensures that the viewer’s attention doesn’t drift from your content to how you manage color.
Jakob’s Law
This law, also known as the Law of Internet User Experience, states that any user is more likely to engage and understand working with a new system or interface if they are similar to others with which the user is already familiar. The application of this design system is well-known if we think about the Microsoft OS releases and how they follow a trend in aesthetics and function placement (as in menus, contextual menus, general behavior, etc.), and so does Apple on its Mac OS systems or their iPhones – let’s remember the uproar triggered by the decision to remove the iPhone’s Home Button.
Users tend to resist change, which is a natural process in human nature. Jakob’s Law, used in website development, is applied when companies seek an image makeover on their websites but opt not to alter the layout that much to bring a sense of familiarity to the user (i.e., placement of the cart, menus, login area, etc.). As users are already familiar with the functionality of that website, they will find the aesthetic changes exciting rather than a nuisance to learn how to operate the website from scratch. This principle is particularly useful for e-learning sites, as the idea is not to distract the user from the learning objective.
In presentation design, Jakob’s Law is of particular significance for corporate presentations, as presenters should opt to remain within the color palette associated with the brand identity of their corporation rather than innovate with striking color schemes. There are plenty of suggestions on selecting color schemes associated with a certain psychological effect or monochromatic schemes in our article about color theory for presentations.
Applying familiar design elements is recommended for ongoing meetings, as the audience gets familiarized with your method of showcasing ideas rather than needing to interpret images on the go. Consistency is another recommended guideline to follow, covering font styles, color schemes, visual aids, etc. The idea is that presenters don’t hop from one design style to another when changing slides. Instead, create some “special” layouts should your presentation require it, but remain consistent about the color palette and font styles.
Law of Proximity
Next, we move on to the Law of Proximity, which states that items can be perceived as related if they are placed close together. This law can be presented as the Gestalt principle of proximity, and its main role is to help designers understand how humans relate to visual information.
The idea of using the Law of Proximity for PowerPoint presentations is to start by considering whitespace. Quite often, presenters neglect the background in presentations, filling empty areas with unnecessary/unrequired elements for the sole purpose of not counting with blank areas. Rather than helping the slide, it does the opposite effect. Our recommendation is to consider whitespace as an ally. Use whitespace to separate unrelated information to help your concepts to be presented properly.
As we mentioned with Fitt’s Law, grouping elements together helps users to comprehend the information as a unit. You can use this concept to group text styles (heading, subheadings, body), bulleted lists, and images belonging to the same topic. This method of organization boosts the retention rate for presentations as you create multiple association patterns.
Grids can help your designs to bring balance to the slide. You can arrange information according to a left-to-right reading model (or right-to-left, depending on your language’s native method), expose hierarchy for content (when elements take more than the assigned space for an average element on the grid), or reinforce your message by pairing a grid with a color hierarchy system.
Law of Similarity
Have you ever felt that some objects look familiar between them? Well, the Law of Similarity states that objects that look similar are perceived by the human mind as related – a concept that can be used in conjunction with the Law of Proximity, Hick’s Law, and Jakob’s Law.
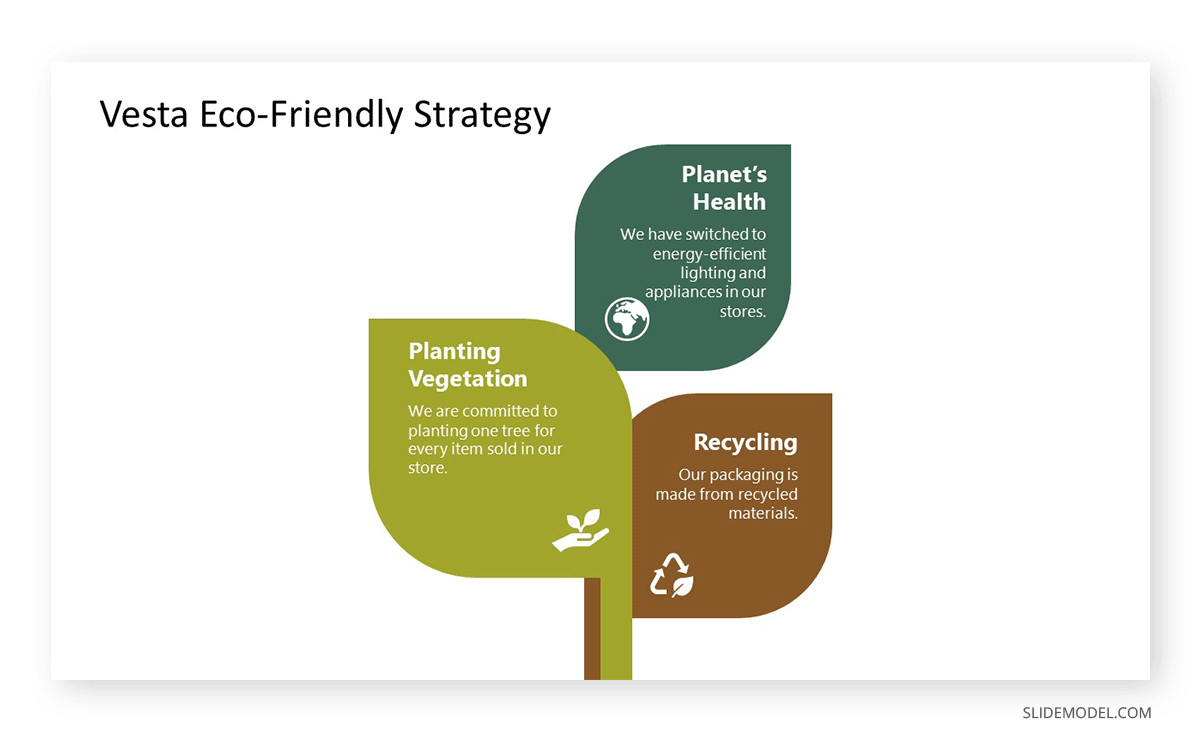
One simple rule to apply these guidelines in your presentation designs is to group together elements that share similar graphic characteristics (as in PowerPoint shapes, color, textures, etc.) This application helps to create a cohesive message across your group.
Contrast, on the other hand, can be used to create an emphasis and identify key ideas. The quickest method to create this effect is to work with a complementary color scheme, where the contrasting colors help to differentiate elements in a slide as contrasting ideas.
Suppose you aim to build consistency across your designs. Using repeated patterns grants that effect, which can be accomplished by using a grid pattern or different shapes with a layout that helps them to be showcased as pieces of a big scheme. If you work with charts and graphs, don’t make them stand out (unless strictly required), but rather use colors that belong to the color scheme of your presentation.

Law of Simplicity
This design principle is related to several other rules and is often mixed with the Law of Prägnanz. We will elaborate more on its differences when we mention the latter. The Law of Simplicity speaks about the value of creating simpler designs rather than complex compositions, as the first ones are easier to understand, use, and remember. Minimalism is a style born out of this design principle.
Regarding presentation design, we can use the following ideas to enforce the Law of Simplicity in our presentations:
- Be selective about what to emphasize: Since this law speaks about focusing only on the core elements of any idea, make those concepts stand out with the help of graphical cues.
- Design consistency: What do all minimalistic themes have in common? Their color palette is well-selected for not to compete about what it is intended to present. Typefaces do not look singularized at any stage but rather as a part of an aesthetic concept, and the same can be studied in relation to spacing, as it helps to build coherence across the design.
Law of Closure
Another Gestalt principle is the Law of Closure, which explains how the human brain tends to fill in missing information to create a completed image. This perception phenomenon has been studied by neuroscientists over and over to understand how the brain continues to work effectively after severe traumatic injuries, but closer to our discipline, designers pushed this law to the limit to create attractive content by the sole idea of curiosity: “what is this image trying to show?” – that’s a common example of how the average user may react, and an effect that can become viral such as in the case of the Steve Jobs tribute logo by Jonathan Mak Long.
Let’s move on to how to apply the Law of Closure for presentation design. You can start by using analogies to explain complex ideas since the graphic representation evokes a memory from the user – most commonly, a mental cue related to a pre-acknowledged concept – simplifying the explanation of a new complex idea.
If your presentation has to introduce expectations, you can use the progressive disclosure technique to reveal the key elements of your presentation. This can be managed by showing parts of an object, subtle enough to help users get the idea of what will be presented but not as clear as the message gets understood after a few seconds. This effect builds excitement and helps the audience remain attentive to what the presenter will say next.
Law of Symmetry
The application of symmetry in design dates all the way to the ancient world, as research indicates. Perhaps its most commonly known use is associated with the Greeks and Romans and their pursuit of perfection in the design of architectural structures, sculptures, and other art forms. For presenters, applying the Law of Symmetry is important in building balance out of a presentation slide.
As the Law of Proximity mentions, grids are assets of immense value to designers. You can work with grids to create a sense of balance, then decide how to place your graphic elements according to their hierarchy.
Symmetry can also be used in unexpected ways, such as in conjunction with the Law of Closure, to create graphic effects that build the expectation of the viewer to unveil “the truth” to them.
Law of Continuity
This law, also known as the Gestalt principle of continuity, explains how the human brain perceives graphical information – as in the case of the Law of Closure. In this case, it exposes the case of how we tend to perceive objects not as isolated elements but rather as continuous and flowing in our reality, up to the point we can come across similar elements within the next second.
How does this work? Let’s use the example of coming across a car model – a Ford F150 Raptor. You saw that car model once at a traffic light cross, but suddenly you start noticing not only that one but two, maybe four, on your way home. Scientists can explain this phenomenon by introducing how the Reticular Activating System works in our cognitive functions and perception of reality. It is not that more cars of that same model started floating around your space; you made a brain association and started noticing them.
That core idea can be applied to presentation design by understanding the concept of flow – an idea greatly exposed by Mihaly Csikszentmihalyi. When you induce the audience to experience a flow state, their interest is 100% in what you speak about. Their attention rate increases as your talk resonates with them on different levels, from satisfying a scientific curiosity to finding real-life applications of your discussion. We can introduce the flow element by accompanying the speech with a well-crafted slide design, where all elements seem to be in a continuous state of interconnection. No idea looks vague or out of context, and how your content is structured helps to approach another topic – perhaps not as relevant to the one you discussed, with ease.

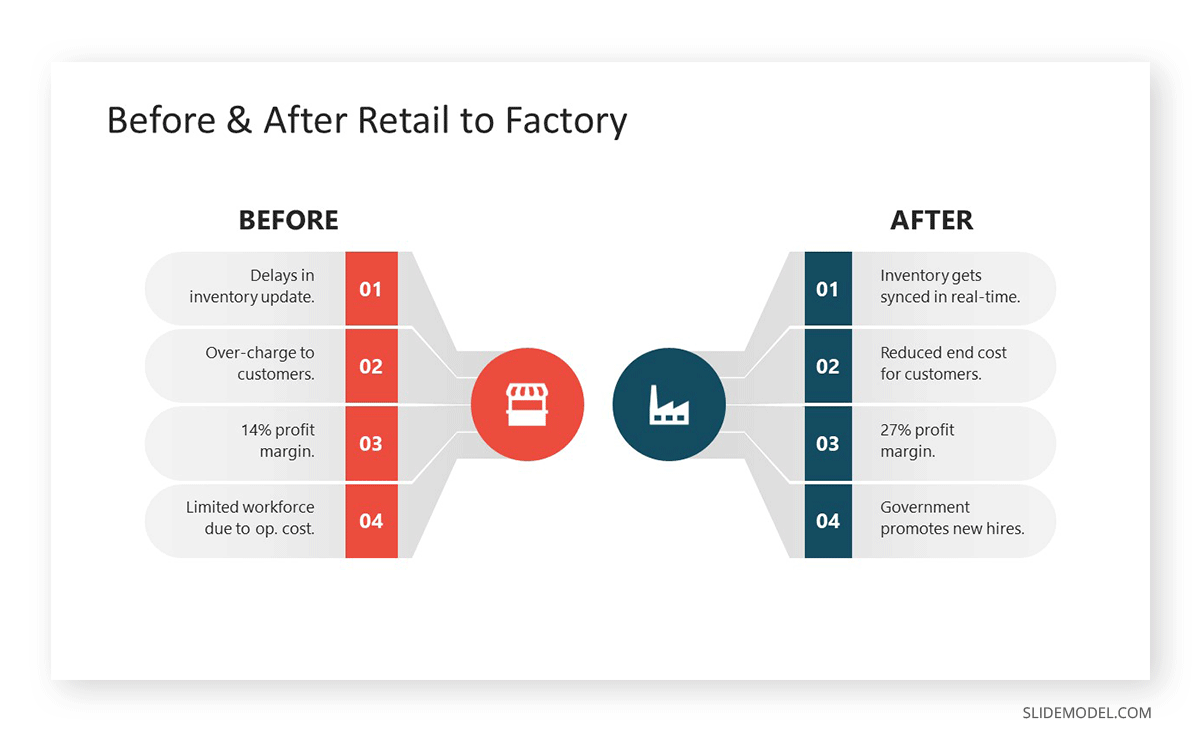
Transitions help to express this idea of flow. You work with progression for disclosing ideas, as when you present a before and after case to highlight the efficacy of a solution. The after state is not alienated from the before one but is immediately sensed as a by-product of applying the solution you present. When that formula fails – such as in bad photo staging applications (i.e., to promote a cleaning solution or a weight loss program with unrealistic results) – that’s due to breaking that continuity state. Hence, people notice a forced action rather than the consequence of a process.
Law of Feedback
The main idea people get when talking about feedback is to deliver a review of a completed service to a company or person. This law does not alienate that much from the idea, as by getting feedback from the audience after an action is completed.
Although it may seem non-relevant, this law relates to the audience interactivity and engagement factor. Say you are presenting a new OS to your audience. The way you showcase how the system loads is a visual indicator of action. Users expect to see the final result, giving the presenter vivid feedback if the said result meets their pre-conceived image. This model is commonly used in product presentations.
There are other ways in which we can apply the Law of Feedback:
- Introduce quizzes and polls throughout your presentation to evaluate whether the audience understands your concepts.
- Sound effects, as when loading an element, can be added to your presentation for interactive purposes, such as when you count votes for an idea or present a countdown format.
Law of Prägnanz
Remember when we spoke above about the Law of Simplicity? Well, the Law of Prägnanz is a related concept that states the human brain tends to perceive objects in their simplest format but with the highest level of meaningful interpretation. Let’s place a couple of simple examples to understand this design concept.
When you come across a new design for a Nespresso coffee machine, what is your initial reaction? Label a similar form to describe what the machine looks like. You understand this coffee machine works with capsules, and you understand the technology behind making it work. Yet, your brain resumes the physical aspect of the said machine as “a prism that is larger in depth than its width, which boosts a water tank on its rear side and a tray to place a coffee mug in the front.”
Another example can come when we stand before a complex geometry used as a pattern. The first action our brain takes is to interpret that figure as an ensemble of lines and curves.

To summarize how to apply the Law of Prägnanz in presentation design, the core point you ought to master is that simple and clear works best than complex. This idea applies from the language you use to the images you place in a presentation. You can complement with some of the other laws in this article on applying contrast to create emphasis.
Law of Aesthetic-Usability Effect
To quickly explain the Law Aesthetic-Usability Effect, we need to understand the link between the perception of a design aesthetic and how it impacts user experience. For example, you browse for a website instructing you on working with the golden ratio for presentations. You come across two websites, one with only theoretical content, so badly arranged to the point it feels more confusing than some bibliography material you can find in a library. Then, you find another website that not only breaks concepts into smaller, understandable pieces but also adds interactive examples so users can test the application of the golden ratio.
That simple example written above explains how the Law Aesthetic-Usability Effect influences the user experience in terms of the perception of usability. Suppose content placed in a presentation feels confusing. In that case, the audience will divert its attention from the presenter to the immediate object or person that grants some “fun time” for the remainder of the presentation. Therefore, as a presenter, you failed to expose concepts and retain the audience’s interest.
Law of Cognitive Load
Considering the amount of time the average academic spends trying to grasp new concepts during conferences, we must talk about the Law of Cognitive Load. This law states that the mental effort required to understand/process information has to be minimized to build a more pleasant experience for your audience.
Going back a few steps to the example of the conference, the average model of a congress outlines between 5-8 different talks about scientific findings per day, each spanning about 20 minutes + a Q&A session. During the day, the attendees get breaks to interact with colleagues or discuss theories and discoveries during poster sessions. How does a person get a firm grasp of all the content acquired during the day? And we don’t ask this question believing it should be static content but rather information that builds cooperation projects between teams. The Law of Cognitive Load replies to this question by applying these guidelines to presentations:
- Using quality visuals: Charts, graphs, videos, or images reduce the need for written content in a presentation. If the visual element has enough content quality, it will also work as a memorable item by which attendees shall refer to the presentation (i.e., “the presentation with the video demonstration of the process” or “the presentation with the orange & navy charts”)
- Limiting text & bullet points: Instead of bombarding the audience with text blocks, include the text that is crucial for understanding the idea you want to express. Bullet points work well for summarizing content or outlining ideas, so don’t use them for huge walls of text.
Law of Expectation
We previously mentioned that it is within human nature to resist change. Whenever a product or service doesn’t behave as “expected,” there is a disappointment/anger factor from the user, with a broad range of emotions associated depending on how many hopes were placed on that ideal state.
The Law of Expectation describes the intrinsic relationship between a user and an interface defined by how the user expects the interface to work and how the interface behaves in real life. Simple examples that can help us picture this law are:
- Browsing for content on a social media platform only to find out the app doesn’t refresh the publications. The reason is a problem related to server load, but the user goes on and on about the “awful app.”
- When you purchase a product via an e-commerce site in a smooth process, only to receive something far different from what was promoted in the publication’s images.
In terms of presentation design, the Law of Expectation can be mentioned when you are waiting for a certain aesthetic quality in the presentation design only to be surprised by low-quality graphics, poor font choices, or bad placement of graphic elements. Other problems related to this point are technical issues, such as when the presentation cannot be streamed and the presenter has to move on without slides. Still, the speech references “the graph included in the slides” to explain a point.
To remain within the safe side of the Law of Expectation, presenters should first ensure to meet the cultural expectations of the audience: it won’t be the same to deliver a presentation about cutting-edge technology to a group of researchers on the same field as deliver it to a group of ordinary people. Language also matters from a cultural perspective, as some people feel awkward when the speakers present to the audience in a “too casual manner” for a professional talk. Symbols and icons used in presentations can have different cultural significances, so best to browse for their meaning before listing them in presentations.
Law of Relevance
Presenters seek the best methods to guarantee their audience’s interest, so we need to discuss the Law of Relevance. In essence, this law describes that the relevance of the content presented to the audience’s needs and interests directly influences the reception of a presentation – in terms of satisfaction and engagement.
Applying this law to slide design starts from curating the content to present regarding the initial audience analysis: who are your average viewers, which are their interests, and what drives them to attend your presentation? Then, organize the content in a manner that builds a narrative about the ideas to introduce – for this, storytelling is a great tool to drive the audience’s engagement.
Law of Social Proof
The Law of Social Proof is of particular relevance for presenters that need to establish trust with the audience, such as in the case of sales presentations. Instead of focusing on cold aspects of your product, like reading a data sheet about the specs of the product, you opt for the social factor in the shape of testimonials, case studies, awards, and the social media engagement your product drives (NB: this last point only applies for presenting a product to potential investors or when talking about startup presentations)
Von Restorff Effect
The final law presented in this article describes a phenomenon by which an item that is different from the elements surrounding it not only stands out but is more likely to be remembered. This Von Restorff Effect works on the contrast stimuli, generating associated ideas to the visual cue presented.
To some extent, the Von Restorff Effect is the antithesis of the Law of Similarity. Instead of discussing creating a cohesive design, we talk about singularizing an element to be remembered – breaking the pattern, sort to speak.
Therefore, how can you use the Von Restorff Effect in your presentations? Let’s place some examples:
If you aim to talk about statistics and singularize an element, you can present the data as a series of white dots, all equal-sized, and place – at a random location – one dot painted with red. Then, speak about why that element is singularized, what proof or research led to this finding, and how it affects the overall picture.
Visual cues, like icons or images, can help concepts to be easily retrieved when discussing a presentation sometime later. A photograph of a tortoise with its head wrapped around a plastic net certainly makes a connection to the importance of processing oceanic plastic waste.
Tools to apply the Laws of UX in presentations
After studying the different laws of UX and their role in presentation design, it’s time to discuss which tools may help your journey to implement these laws into your work.
Graphic Design Software
Software solutions like Adobe Creative Suite or Affinity Designer help thousands of users around the globe to create high-end graphics. Their broad range of tools allows us to create grid patterns easily, work with relations for item placement, analyze which ideas work best with different mockups, and more.
If you intend to create custom images for your presentation, we highly recommend you become proficient with graphic design software or hire a professional rather than only using stock images. It’s about adding value and not repeating what’s already been used.
PPT Presentation Templates
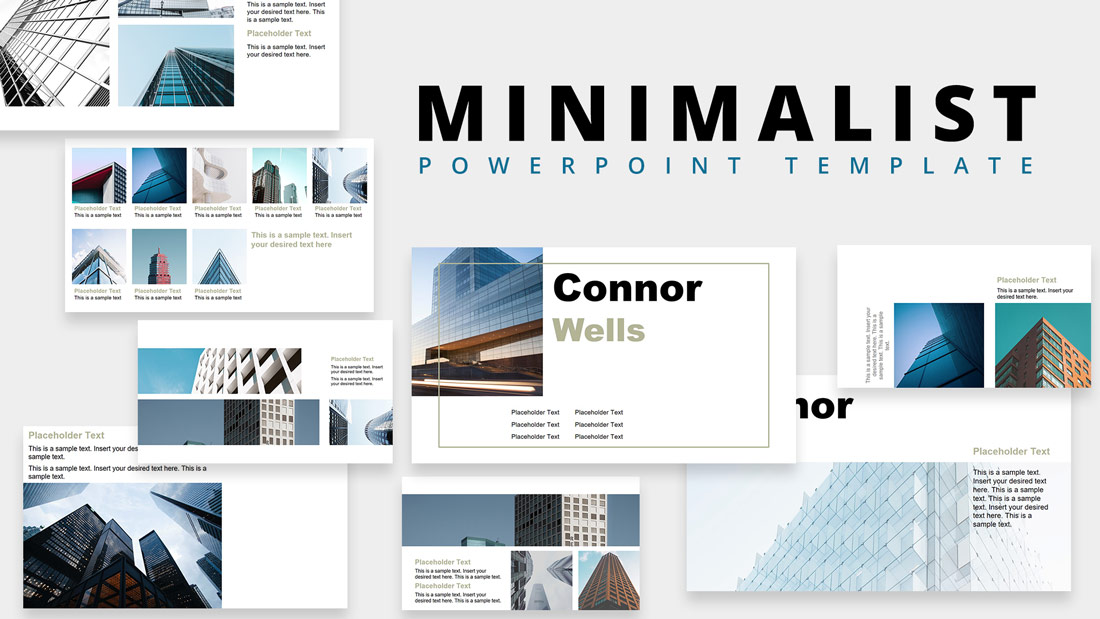
If you don’t feel confident about your graphic design skills or lack time to experiment with different layouts, sites like SlideModel offer an extensive selection of templates you can browse by keywords or categories. These designs were created by professionals who master these rules and work to deliver the best quality results to users.
Grab a design you like, customize it to your preference, and add the content. Voilá! A well-designed presentation is ready to be delivered.
Balsamiq or InVision Freehand
These two UI prototyping tools emulate the experience of a whiteboard or sketchpad. They are ideal for collaborative projects demanding a presentation, as users can brainstorm what they desire from the slides and a basic structure. Then, designers can work on the guidance provided by those sketches and turn prototypes into quality results.
A/B Testing Tools
The concept of A/B Testing is to contrast and compare two versions of a webpage or advertisement with the sole purpose of driving more conversions. We can apply the same idea to presentation slides by browsing for A/B tools that work with images; that way, we can analyze the relationship between text density and images, if we comply with adequate color contrast, etc.
Conclusion
As we have seen through this guide, UX Design is a complex topic to approach, with different and sometimes contrasting ideas. The key takeaway of this article is to select the laws that are fit for the kind of work you produce, then incorporate those laws little by little and test the results they bring to your presentation slides.
Don’t feel overwhelmed about not following any of these guidances at the present moment. Being a proficient presenter is about keeping an open mind to new ideas and being ready to accept mistakes as part of a learning process. Good luck!