Delivering factual information transcends mere accuracy—it’s about crafting a narrative that transforms raw data into a persuasive, memorable experience. Whether addressing a boardroom or conference audience or delivering a marketing plan presentation, facts and figures can elevate your message from informative to transformative.
This guide explores advanced strategies to achieve that, diving deep into visual storytelling, structured information flow, narrative engagement, and the delicate art of handling sensitive topics. The techniques here are designed to help presenters refine their craft, leveraging psychological insights and practical tools like Google Slides templates to maximize impact. Each section offers detailed, actionable advice to ensure your facts inform and inspire action.
Table of Contents
- How do we Define Presenting Facts?
- Visual Storytelling: Bringing Facts to Life with Slides
- Structuring Factual Information for Maximum Impact
- Highlighting Key Facts and Statistics
- Strengthening Factual Claims with Supporting Evidence
- Presenting Facts on Controversial or Sensitive Topics
- Maintaining Objectivity and Neutrality
- Ethical Considerations in Presenting Facts
- Global and Cultural Considerations in Fact Presentation
- FAQs
- Conclusion
How do we Define Presenting Facts?
Presenting facts is communicating objectively verifiable information in a clear, accurate, and relevant manner, ensuring it is understandable and meaningful to the intended audience. This definition captures the essence of sharing facts effectively in everyday conversation, educational settings, or professional contexts. Let’s break down the key components of this definition:
- Objectively Verifiable Information: Facts can be proven true through evidence or observation, distinguishing them from opinions or subjective interpretations.
- Clear and Accurate: The information must be presented to avoid confusion or error, using precise language and ensuring the facts are correct and up-to-date.
- Relevant: The facts should matter to the topic or audience, making them impactful and valuable in the context.
- Understandable and Meaningful: The presentation should be tailored to the audience’s needs, providing enough context to make the facts comprehensible and significant.
This process applies across various scenarios—explaining a scientific discovery, recounting an event, or supporting a point in a discussion—while emphasizing an unbiased approach to effectively informing or educating.
Visual Storytelling: Bringing Facts to Life with Slides
Visual storytelling lies at the heart of impactful presentations, driven by how our brains process information. A 2014 study by Potter, published in Psychological Science, revealed that people can recognize images in just 13 milliseconds. Text, however, takes far longer—hundreds of milliseconds—due to the multi-step process of decoding letters, recognizing words, and grasping meaning. This speed advantage makes visuals a powerful tool for delivering complex data fast. When presenting facts and figures, the choice of visual matters: bar charts excel at comparing discrete categories, like regional sales, leveraging our ability to judge lengths instantly, while line graphs highlight trends over time, such as revenue growth, tapping into our pattern-spotting instincts.
This effectiveness is amplified by research from Richard E. Mayer, a leading educational psychologist. In his seminal book Multimedia Learning (2009), Mayer introduced the “multimedia principle,” showing that combining text with relevant images boosts comprehension more than text alone. Engaging verbal and visual cognitive channels reduces mental strain and enhances retention—insights that have shaped modern teaching tools and are directly applicable to presentations. Whether in classrooms or boardrooms, Mayer’s work underscores why visuals paired with concise text resonate deeply.
Audience diversity adds another layer to consider. Claire L. Grady’s 1994 study, published in Science, explored how aging affects visual processing. Using functional MRI, she found that older adults showed reduced brain activity in areas like the prefrontal and medial temporal cortex during memory tasks, linking this to poorer recall. This pioneering research was among the first to tie age-related memory decline to neural changes, offering key insights into cognitive aging. For presenters, it’s a reminder that visual communication must be clear and adaptable to reach all viewers effectively.
Crafting Slides with Purpose
Great visuals hinge on simplicity and intent. Each slide should convey one clear insight—overloading it with data obscures rather than illuminates. A data visualization expert, Edward Tufte advocates this in The Visual Display of Quantitative Information (2001). He calls for maximizing the “data-ink ratio”—using every design element to serve the message and cutting anything extraneous. Strategic choices, like adjusting size to emphasize key points or stripping away clutter, keep the focus on what matters.
Color psychology elevates this further. Blue, evoking trust and calm, suits financial data, while red, signaling urgency, can spotlight a critical shift. For example, a dense table of numbers becomes instantly digestible as a clean bar chart. You can learn more about this in our article on color theory for presentations. Tools like PowerPoint templates make this easier, providing layouts rooted in visualization best practices. Customizing these best PPT templates to highlight one KPI per slide in a marketing plan presentation ensures clarity and professionalism—though tailoring is essential to avoid clutter.
Why It Works
Visual storytelling isn’t just about aesthetics—it’s about leveraging cognitive science to make facts unforgettable in public speaking settings. By choosing the right visuals, simplifying designs, and using purposeful color, you craft slides that don’t just present data—they tell a story that sticks with your audience long after the screen goes dark.
Structuring Factual Information for Maximum Impact
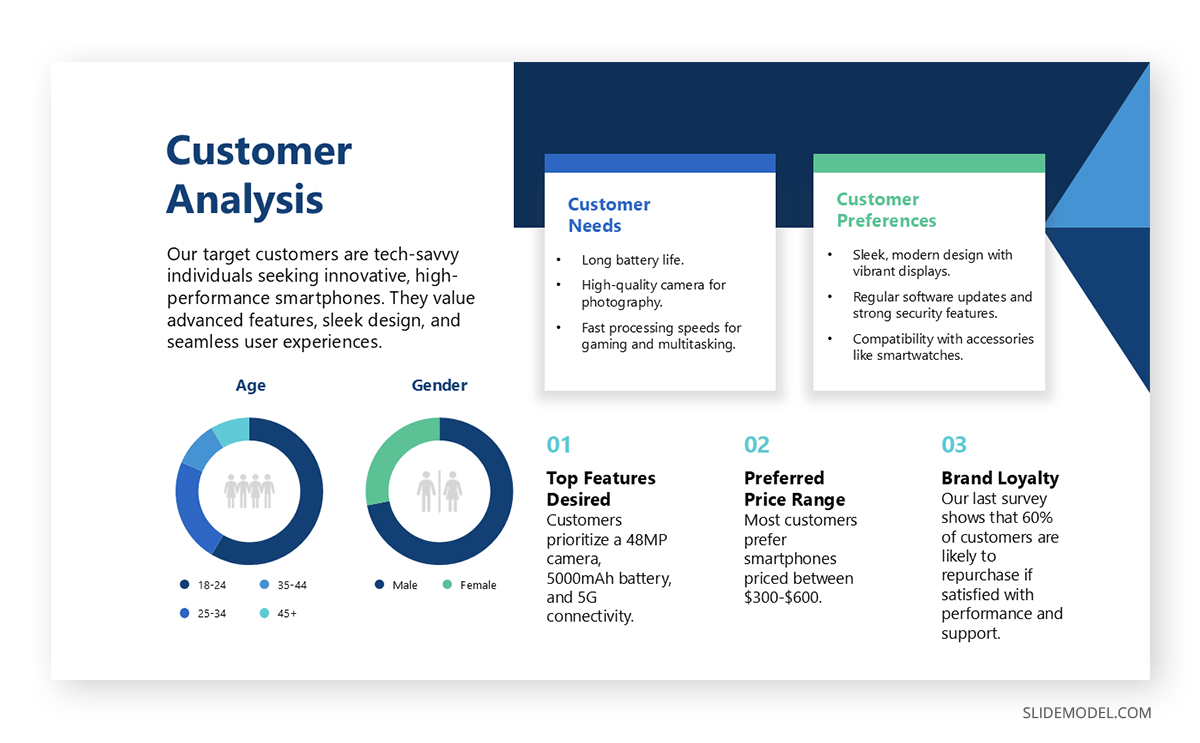
Effective presentation structure is the backbone of any meeting, ensuring that facts are understood and retained. For experienced presenters, this means moving beyond basic outlines to craft a narrative flow that guides the audience seamlessly toward a compelling conclusion. One sophisticated method is the inverted pyramid, a technique borrowed from journalism. It prioritizes the most vital information upfront, capturing attention immediately, then layers in supporting details. In practice, this might look like opening a business presentation with a bold statement: “Our strategy boosted ROI by 25%.” From there, you can unpack the customer insights, campaign metrics, and market analysis that underpin that success, keeping the audience hooked from the start.
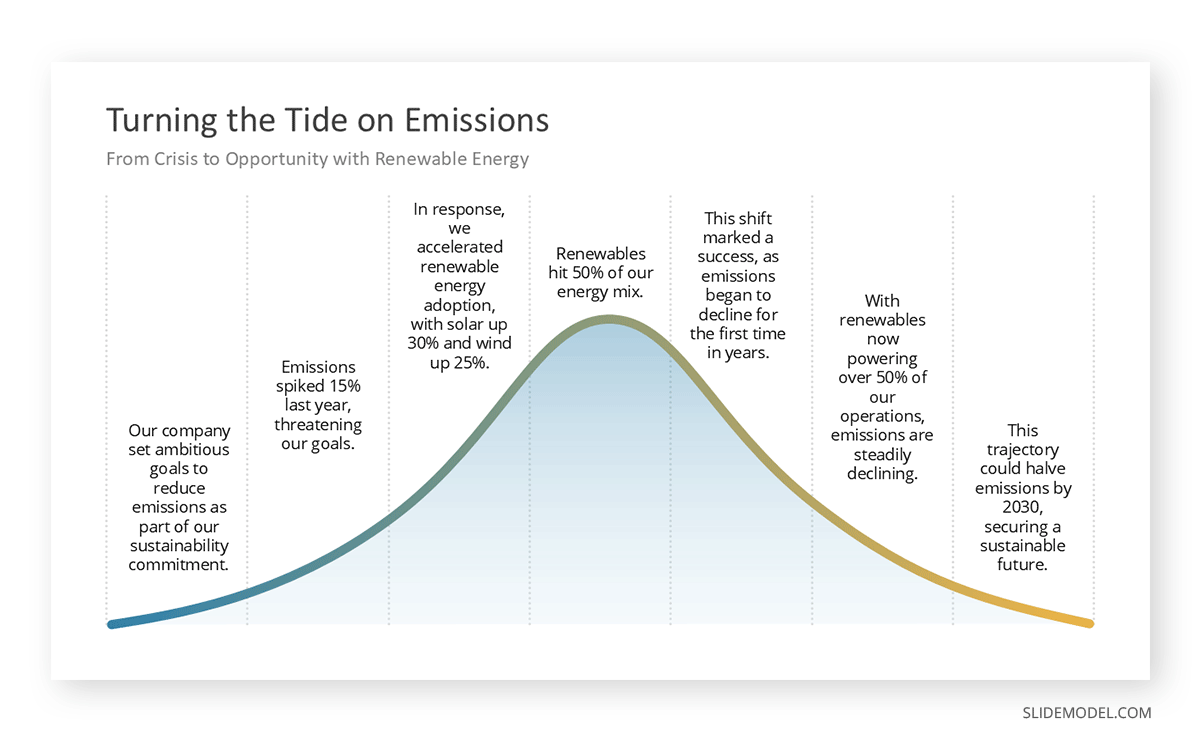
Another robust framework is the hero’s journey, reimagined for data. Here, you begin with a problem or challenge, explore the data as a voyage of discovery, and conclude with an insight or solution. Imagine a sustainability presentation: start with the stakes—“Emissions spiked 15% last year, threatening our goals”—then journey through the data—“Renewable energy adoption surged, with solar up 30% and wind up 25%”—and end with a resolution—“This trajectory could halve emissions by 2030.” This arc organizes facts logically and taps into the audience’s emotions, making the data feel urgent and relevant.
Clarity hinges on guiding the audience through this flow. Verbal signposting—phrases like “Let’s first explore the trends” or “Next, we’ll analyze the results”—acts as a roadmap, helping listeners follow your logic and anticipate what’s ahead. Another tool is the MECE principle, popular in consulting, which stands for Mutually Exclusive, Collectively Exhaustive. It ensures your data categories are distinct yet comprehensive. You might divide sales figures by region, product, and time, avoiding overlap while covering all bases. This meticulous organization prevents confusion and bolsters credibility.
By weaving these advanced structuring techniques into your presentation, you create a path that’s easy to follow and hard to forget. The audience leaves informed and motivated, with a clear sense of how the facts fit together and why they matter.
Highlighting Key Facts and Statistics
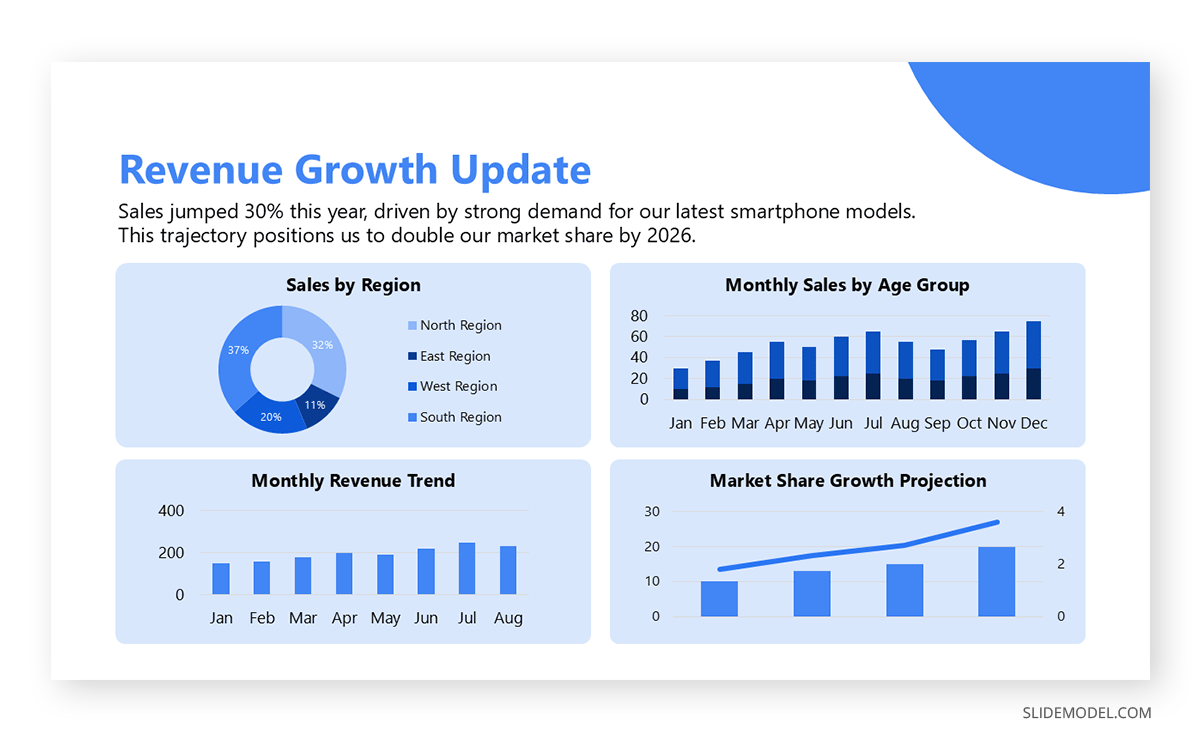
Making key facts and statistics stand out is an art that ensures your audience remembers what matters most. Experienced presenters can draw on cognitive psychology to amplify this effect. The serial position effect, for instance, shows that people best recall the first and last items in a sequence. Open your presentation with a striking fact to set the stage, and close with a pivotal takeaway to seal it in memory. If discussing revenue growth, you might lead with “Sales jumped 30% this year” and end with “That’s a trajectory to double our market share by 2026.”
The von Restorff effect suggests that distinctive items are more memorable. Make critical numbers pop on slides with larger fonts, bold colors, or simple icons—say, a standout red figure amid a sea of gray percentages. Repetition reinforces this: introduce a key fact early, weave it through your narrative, and circle back to it in your conclusion, signaling its weight without overexplaining. Vocally, subtle shifts amplify impact—slow your pace, raise your volume slightly, or pause before and after a big stat to let it land.
Context turns abstract numbers into relatable truths. Rather than “We cut energy use by 10,000 kilowatt-hours,” say “That’s enough to power 100 homes for a year.” Visual metaphors, like pairing a growth chart with a rising arrow, can underscore the point. The trick is balance—highlight only the most crucial data to maintain focus and avoid diluting your message. This ensures your audience carries away the facts that drive your story home.
Strengthening Factual Claims with Supporting Evidence
Robust evidence is the critical component of a credible presentation, and for experienced presenters, it’s about choosing and presenting it with precision and integrity. Evidence comes in many forms: quantitative data offers hard numbers, like a 20% sales increase from a quarterly report; qualitative insights bring in human voices, such as an expert calling your approach “game-changing”; anecdotes add personal flavor, though they’re best paired with broader data; and analogies draw parallels to familiar scenarios, illuminating complex points. Each type has its place, blending them creates a rich, persuasive tapestry.
Citing sources is non-negotiable—point to a “2023 McKinsey study” or a customer survey to anchor your claims in reality and invite verification—you can check our guide on the McKinsey presentation structure for more ideas. Context elevates raw data: a 20% growth figure gains heft when you note it outpaced competitors by 5 points. Transparency about potential biases, like disclosing if your company funded a study, builds trust. Equally important is resisting the urge to cherry-pick. Acknowledging that customer support experiences considerable lags despite high satisfaction shows integrity and preempts skepticism.
Accuracy matters too. A “50% improvement” needs a clear baseline—last quarter, last year?—To avoid confusion, mix evidence types that appeal to varied audience preferences, balancing hard stats with compelling stories. The goal is ethical persuasion: let the facts shine without distortion, reinforcing your authority as a presenter who respects both data and audience.
Presenting Facts on Controversial or Sensitive Topics
Navigating controversial or sensitive topics demands finesse, blending honesty with empathy to maintain credibility and encourage dialogue. Start by recognizing the issue’s weight: “This topic stirs strong feelings, and I aim to present the data fairly while welcoming your thoughts.” This sets a respectful, open tone. Stick to verifiable facts, framing them neutrally—“The data suggests…” rather than “This proves…”—and address conflicting evidence head-on: “Some studies show X, while others indicate Y.” Neutrality avoids fanning flames and keeps the focus on the information.
Inclusive language bridges divides—discuss “our shared challenges” rather than “your side versus mine.” Finding common ground early, like “We all value a thriving community” before diving into divisive stats, eases tension. Expect pushback and meet it with poise: “That’s a great question—here’s more data that might clarify.” Listening actively—restating a concern before responding—shows you’re engaged, not defensive. Posing questions like “What do you see in this trend?” invites participation and softens confrontation.
Wrap up by framing the discussion as ongoing: “This is complex, and I encourage you to keep exploring the facts.” This humility fosters trust and keeps the conversation alive, turning a tough topic into a chance for connection rather than conflict.
Maintaining Objectivity and Neutrality
Objectivity and neutrality safeguard your credibility, especially with facts-heavy content. For experienced presenters, this starts with self-reflection: what biases might you bring? A quick gut check—“Am I assuming this because of my role or experience?”—helps you spot and counter those leanings. In delivery, neutral language keeps the focus on data, not opinion. Swap “our brilliant strategy” for “our strategy, which yielded these results,” letting the facts stand independently.
Steer clear of logical traps—overgeneralizations or emotional appeals—that skew perception. If you venture into interpretation, flag it: “One possible reading of this trend is…” Questions from the audience are a chance to show openness; welcome them and admit when you’re stumped: “I don’t have that answer, but I’ll find out.” This candor strengthens trust. The aim is a presentation that feels like an honest exploration, not a sales pitch, ensuring your facts persuade through clarity and fairness alone.
Ethical Considerations in Presenting Facts
When presenting facts, ethical responsibility goes beyond accuracy—it’s about ensuring that the information serves the audience with integrity and respect. Presenters wield significant influence, and a duty to uphold trust through principled choices comes with that. One core ethical pillar is truthfulness without distortion. This means resisting the urge to exaggerate findings or omit inconvenient data for the desired outcome. For instance, if a company’s survey shows mixed customer feedback, highlighting only the positive responses while ignoring criticism misleads the audience and undermines credibility. Ethical presenters embrace the full picture, even when it’s less flattering, fostering a reputation for reliability.
Another vital consideration is protecting confidentiality. Facts often stem from real-world sources—employee records, customer interactions, or proprietary research—and mishandling them can breach trust or legality. Imagine introducing productivity metrics in a data presentation: sharing individual performance data without consent could humiliate staff and violate privacy laws. Instead, aggregate the numbers or strip identifiers to shield those involved. This not only aligns with ethical standards but also demonstrates respect for the people behind the data, reinforcing your moral authority.
Intentionality in framing also matters. Facts don’t exist in a vacuum; how they’re presented shapes perception. Ethically, presenters must avoid loaded language or manipulative setups that skew understanding. For example, stating “profits soared despite challenges” might imply resilience, but if those challenges were self-inflicted—like poor management—it’s disingenuous not to clarify. Neutral framing lets the audience draw conclusions independently, honoring their autonomy. Similarly, when facts could cause distress—say, reporting a factory closure’s impact—presenters should pair candor with sensitivity, acknowledging the human toll alongside the numbers.
Global and Cultural Considerations in Fact Presentation
Presenting facts to a global audience demands an awareness of cultural diversity that shapes how information lands. What resonates in one region may falter in another, making adaptability a key skill for impactful delivery. Cultural attitudes toward data vary significantly. In data-driven societies like the United States, audiences often expect concise, numbers-heavy presentations as proof of rigor. Yet in relational cultures—think parts of Latin America or Africa—facts may need a human angle, like testimonials or communal implications, to carry weight. A presenter pitching a tech solution might emphasize efficiency stats in Germany but weave in user stories for a Brazilian audience to bridge that gap.
Language dynamics add complexity. Colloquialisms or technical terms can alienate non-native speakers even when using a lingua franca like English. Phrases like “ballpark figure” might puzzle those unfamiliar with baseball, so opting for straightforward terms—“rough estimate”—ensures clarity. Beyond words, non-verbal cues matter: a thumbs-up signals approval in some places but offense in others, like parts of the Middle East. Researching these nuances beforehand prevents missteps and keeps the focus on the facts.
Sensitivity to cultural values can make or break reception. Topics tied to identity—say, family structures or economic disparity—require careful handling. For instance, presenting poverty stats in India should avoid paternalistic tones that clash with local pride or resilience narratives. Instead, frame facts collaboratively: “These figures highlight opportunities we can address together.” Visuals, too, must reflect inclusivity—charts dominated by Western imagery may feel irrelevant to Asian or African viewers. Diverse icons or localized examples signal respect and broaden appeal. You can find a broad selection of images, for all cultural backgrounds, in our vector images templates.
Timing and delivery pace also shift globally. North American audiences often favor brisk, to-the-point sessions, while Middle Eastern or Southern European groups might value a slower build with room for discussion. Misjudging this can rush or bore your listeners. Presenters transform data into a universal tool, uniting rather than dividing their audience by tailoring facts to cultural contexts—through language, framing, visuals, and rhythm.
FAQs
How can facts be presented without overwhelming the audience?
Limit each slide to one key fact, use simple visuals, and pause to let the information sink in.
Why is tone important in a facts presentation?
A confident yet approachable tone builds trust and keeps listeners receptive, avoiding monotony or arrogance.
How do I present facts on a tight timeline?
Lead with the most critical fact, use a single bold visual, and skip extraneous details for brevity.
What’s the best way to close a facts presentation?
Recap the top fact and tie it to a clear takeaway or action step that resonates with your audience.
How do I handle errors during a facts presentation?
Correct them calmly on the spot, thank the spotter if it’s an audience catch, and move forward with poise.
How can I use humor in a facts presentation?
To ease tension without derailing focus, add light, relevant quips—like “Stats don’t lie, but they sometimes nap.”
What’s a creative twist for presenting facts and figures?
Turn data into a mini-quiz or interactive poll, sparking engagement while reinforcing key points.
How to present facts in a virtual setting?
Use screen-shared visuals, keep slides crisp, and leverage chat or polls to maintain connection online.
Conclusion
Presenting facts is an art honed by science. Visuals make data vivid, structure clarifies it, and stories make it stick. Highlighted stats grab attention, evidence lends weight, and sensitivity opens dialogue. Objectivity earns trust. Together, these strategies—paired with tools like fact sheet PowerPoint templates—turn facts into influence. Keep pushing your craft; the payoff is a presentation that doesn’t just inform but moves people.