When making PowerPoint presentations, you might require adding a chart from an Excel spreadsheet. There are different ways you can incorporate such data in your slides, such as by inserting an Excel sheet into PowerPoint or embedding a chart. This guide will show you how to insert Excel sheets into your corporate slides, PowerPoint templates, or even the Google Slides templates you might use in PowerPoint.
How to Insert Excel Table into PowerPoint
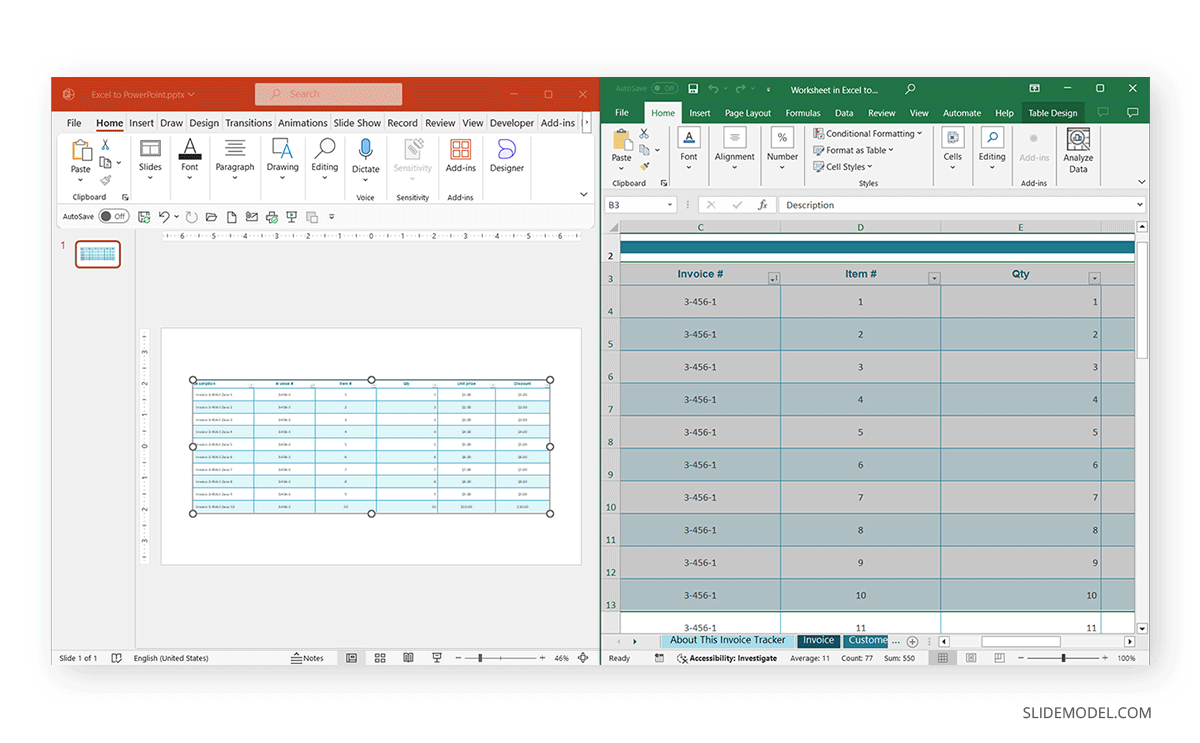
If you’re wondering how to insert an Excel table into PowerPoint, the easiest way to do that is to copy a table and paste it into PowerPoint. However, this method will only work if your content is limited, such as a table with a handful of rows and columns. This is because very large tables will be complex to show on a single slide, where you might want to add the spreadsheet in PowerPoint as an object, which is explained later in this tutorial.
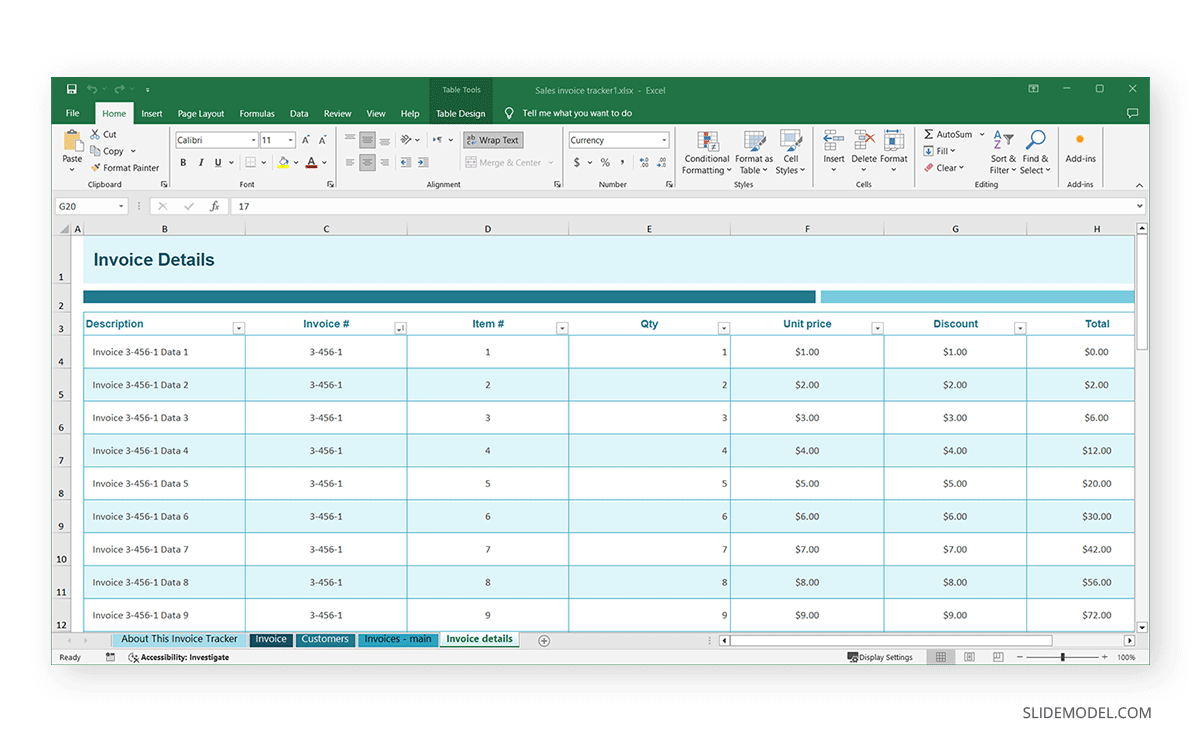
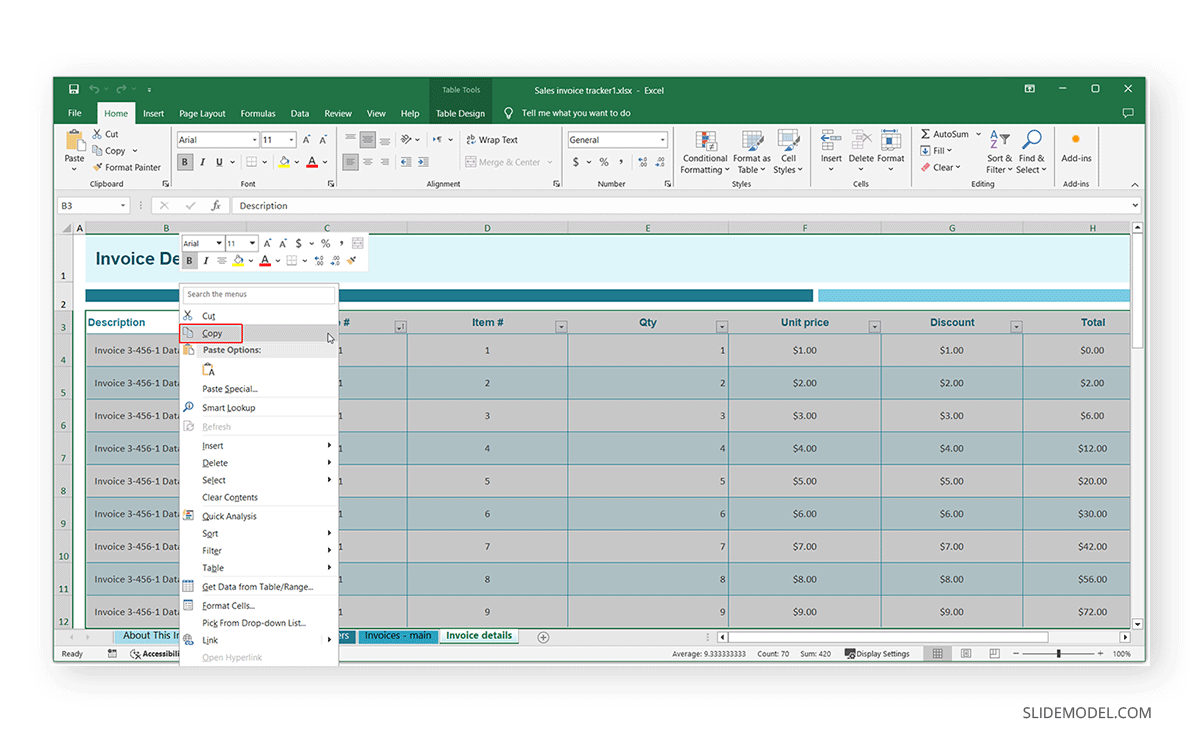
To insert a table from Excel to PowerPoint, select and copy it from Excel. You can use the right-click menu or CTRL+C hotkey to copy the content.
Now, go to the slide you want to paste the table to and select an option to paste the content via the right-click menu according to need. Below is an explanation of the different types of methods you can use to paste your tables from Excel to PowerPoint.
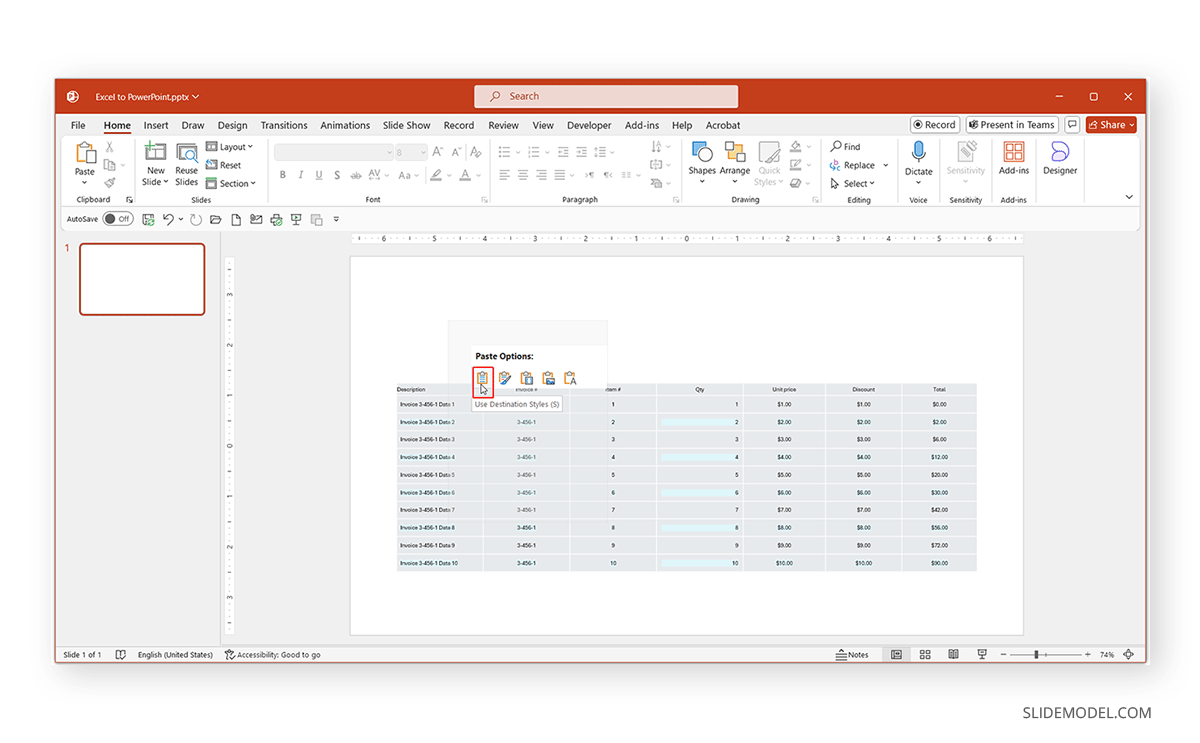
Use Destination Styles
As the name suggests, this option pastes the data using the style of the PowerPoint theme that is in use. This option can be helpful if you want to use not the source formatting from Excel but the formatting of your current PowerPoint file when pasting content.
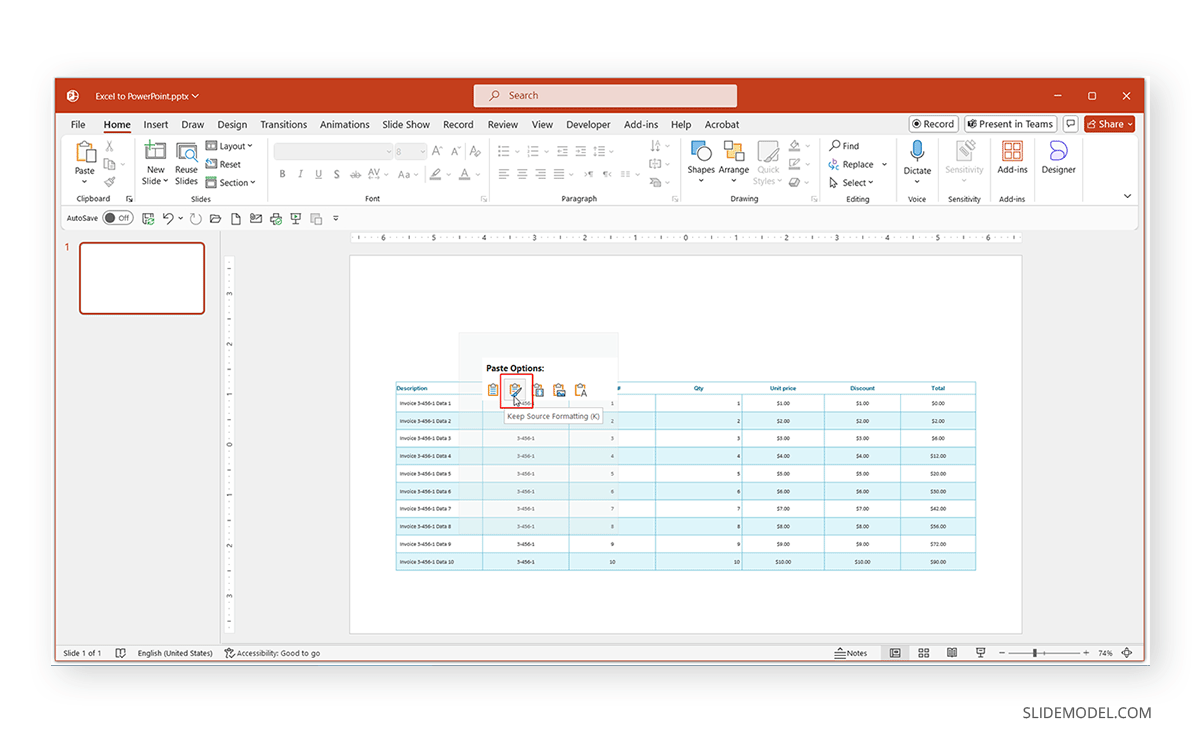
Keep Source Formatting
When pasting your table, use the Keep Source Formatting option to preserve the original Excel file’s source formatting.
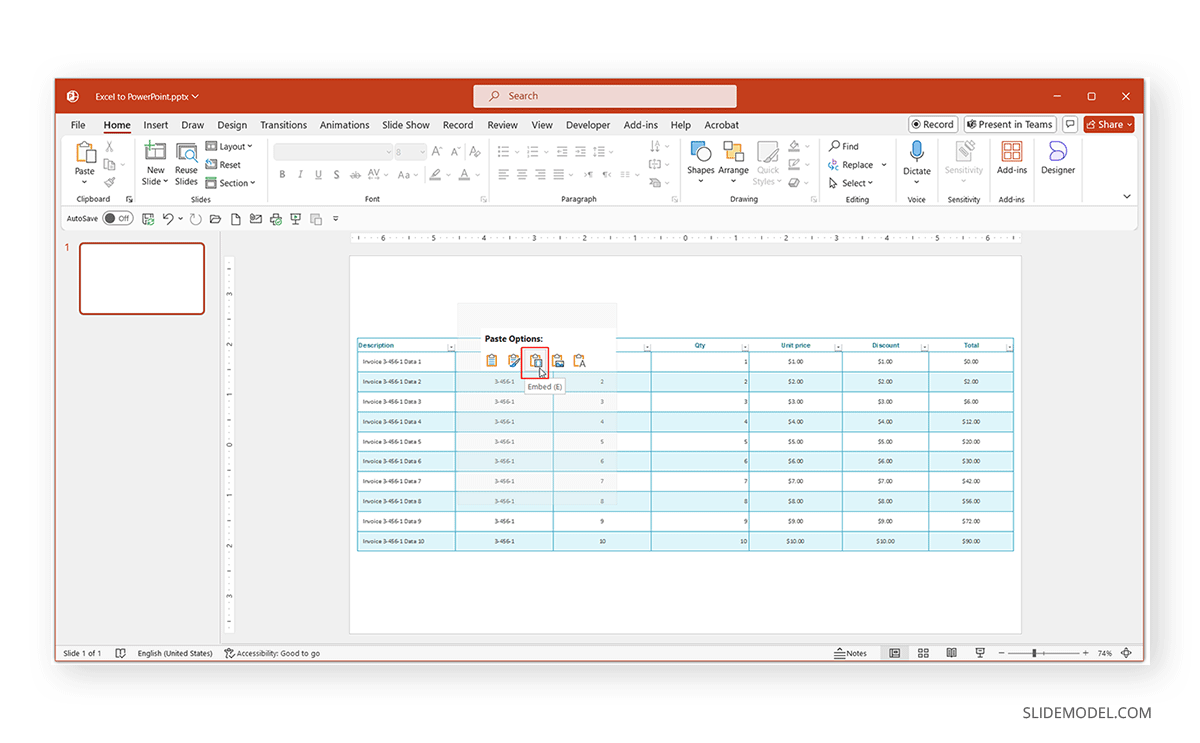
Embed from Excel
Using the Embed option, you can embed your table from Excel to PowerPoint. This will also link the data directly to the source file.
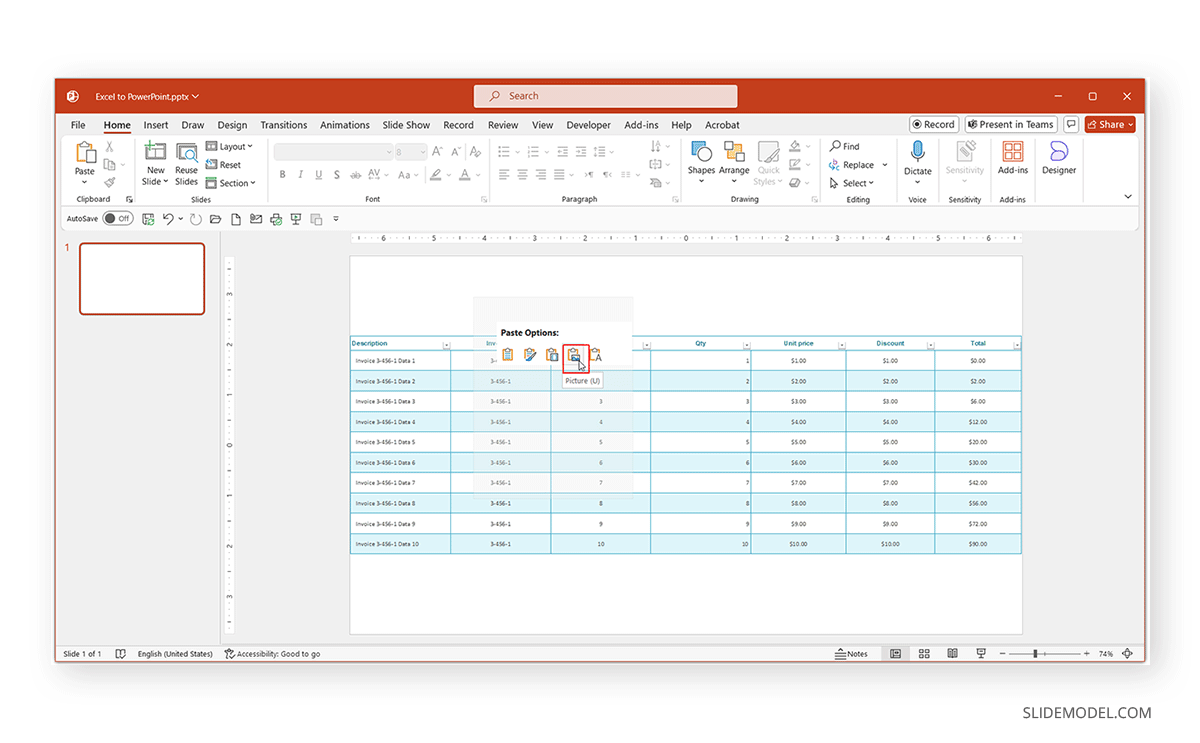
Paste as a Picture
If you don’t want to edit the data later, paste it as a picture in your PowerPoint slide.
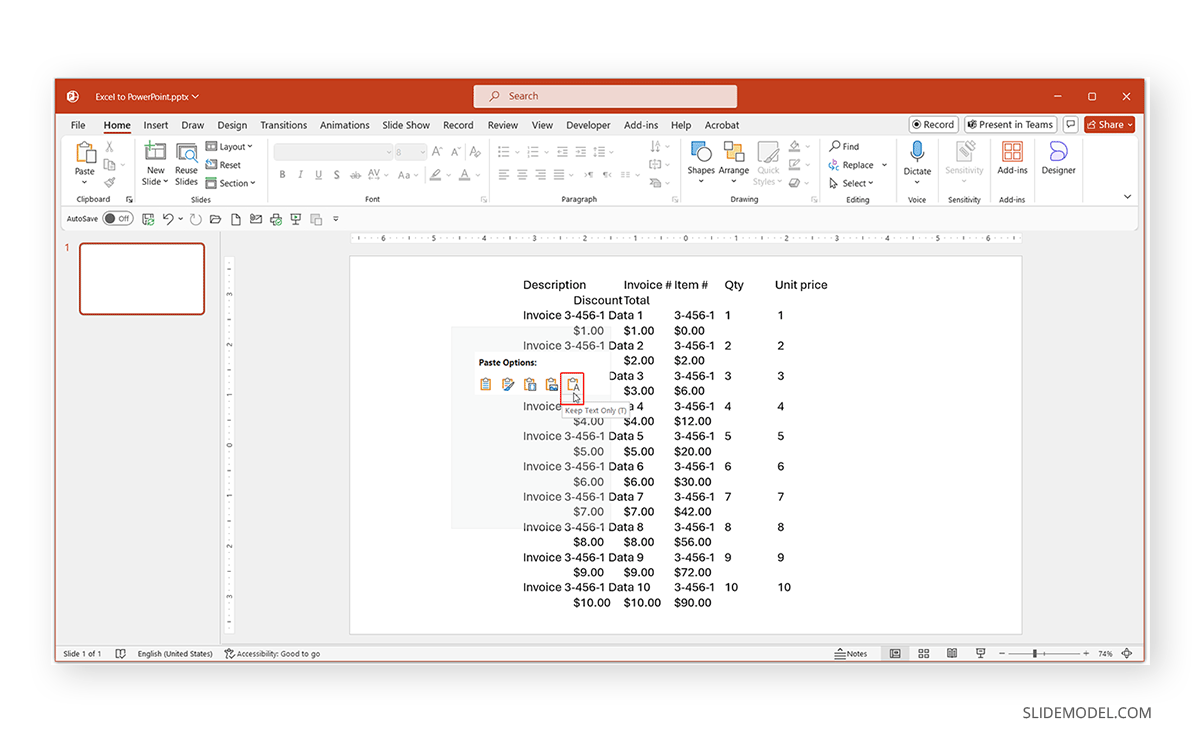
Keep Text Only
If you’re only interested in the text, you can use this option to paste the text into PowerPoint. This will require extensive formatting to make the pasted content look neat on the destination slide, so you might want to use it only when you’re willing to make extensive formatting adjustments when pasting data from Excel to PowerPoint. For more details regarding table formatting options, see our tutorial on creating and formatting tables in PowerPoint.
How to Insert Excel Chart into PowerPoint
While the process for copying and inserting an Excel chart is similar to that of a table, the options provided for pasting the chart differ slightly from those for an Excel table.
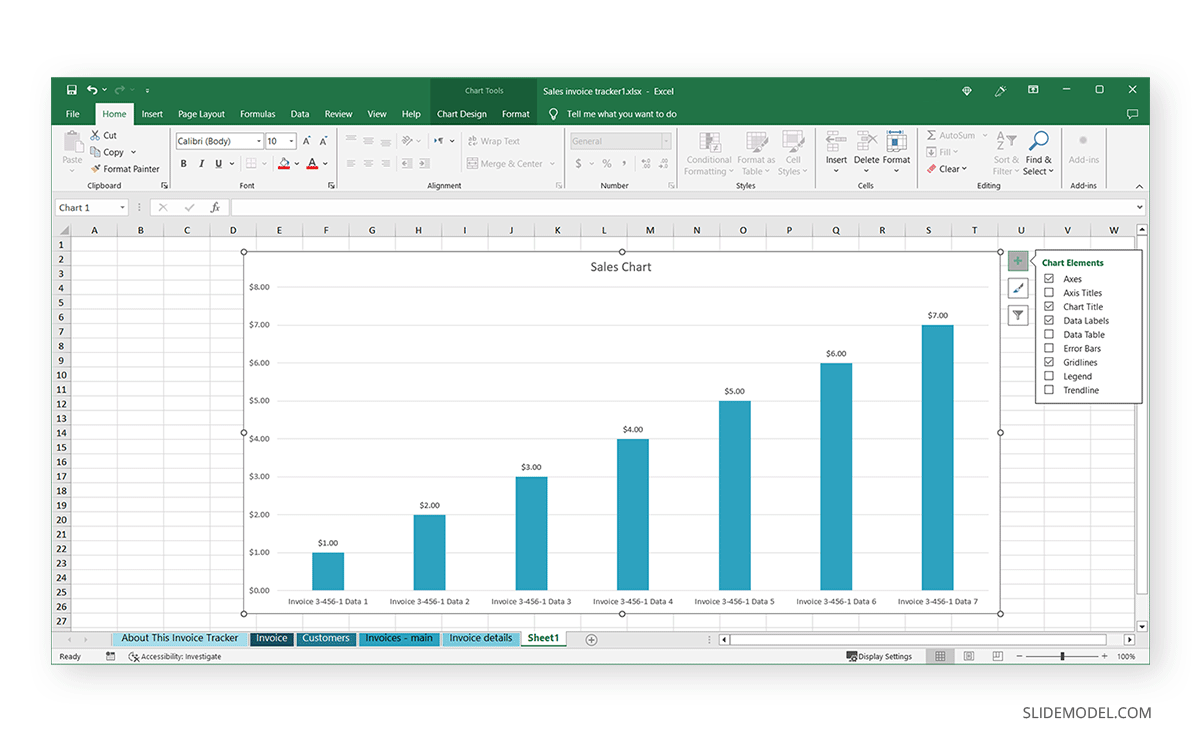
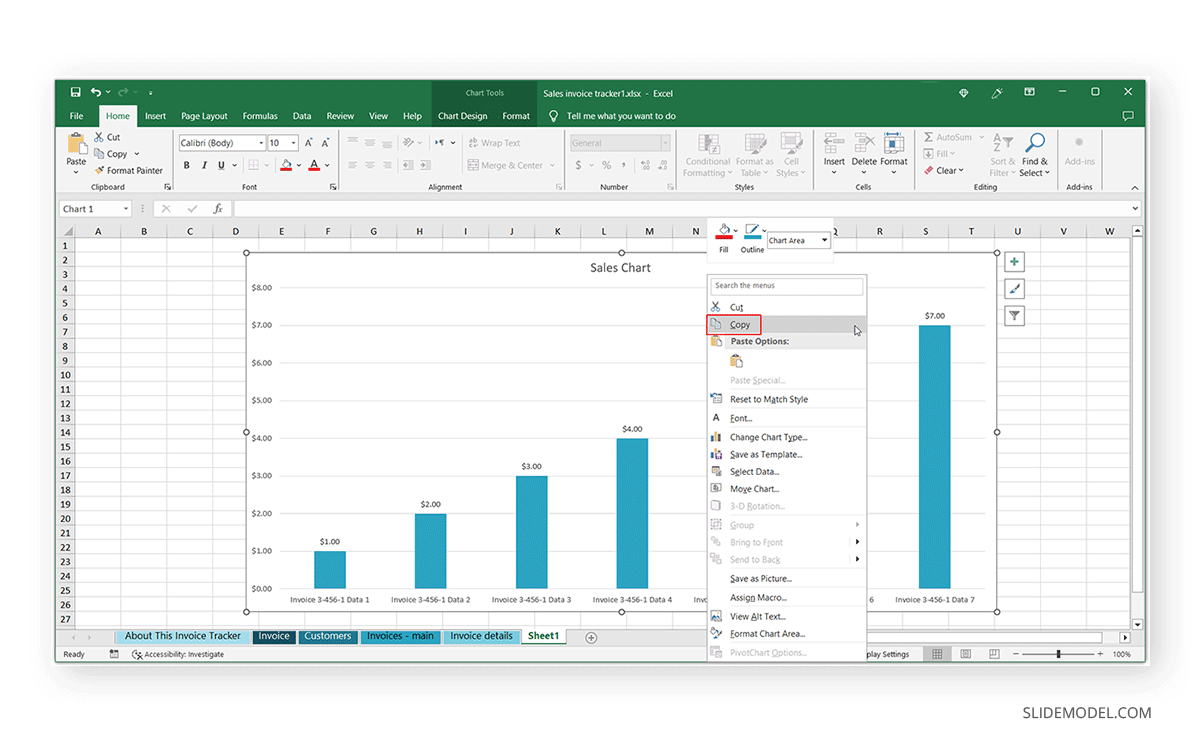
To add an Excel chart to PowerPoint, open the Excel file and select and copy the chart via the right-click menu or CTRL+C hotkey.
When pasting the chart from Excel to PowerPoint, you will be provided with a number of options. Many of these options will also allow you to link your Excel file to the destination slide in PowerPoint.
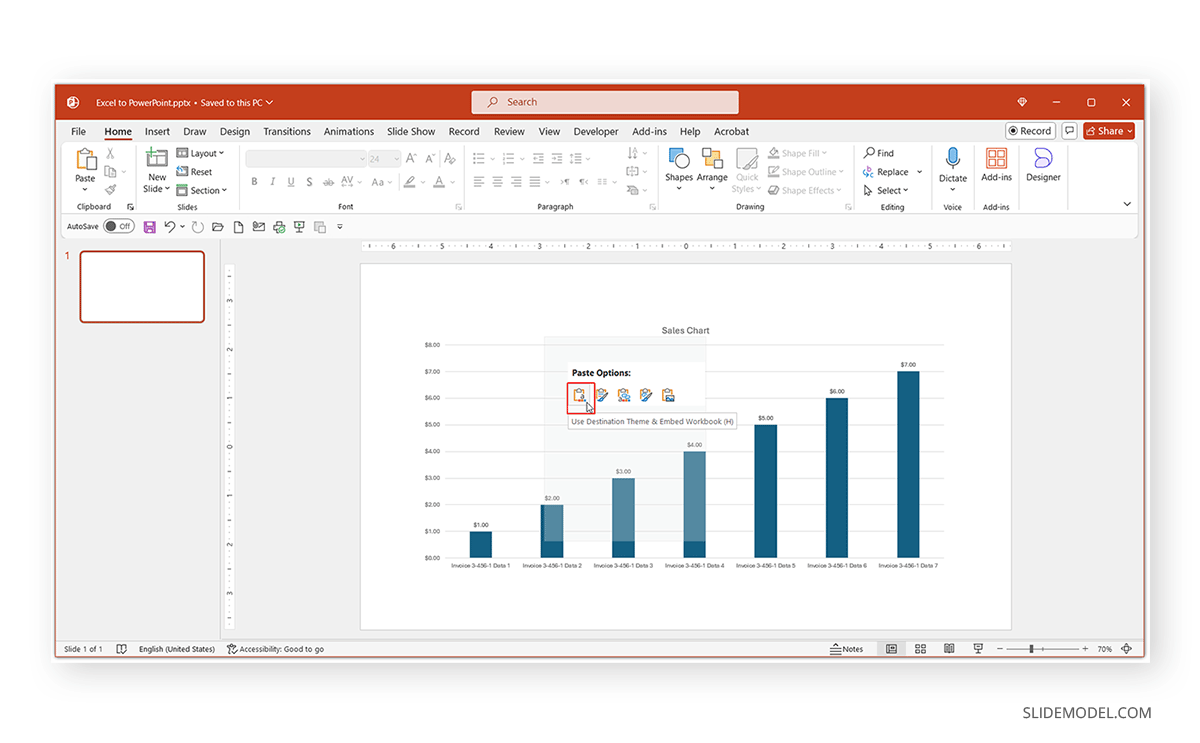
Use Destination Theme and Embed Workbook
This option allows you to embed the Excel file in PowerPoint while retaining the formatting of the PowerPoint file when pasting the chart.
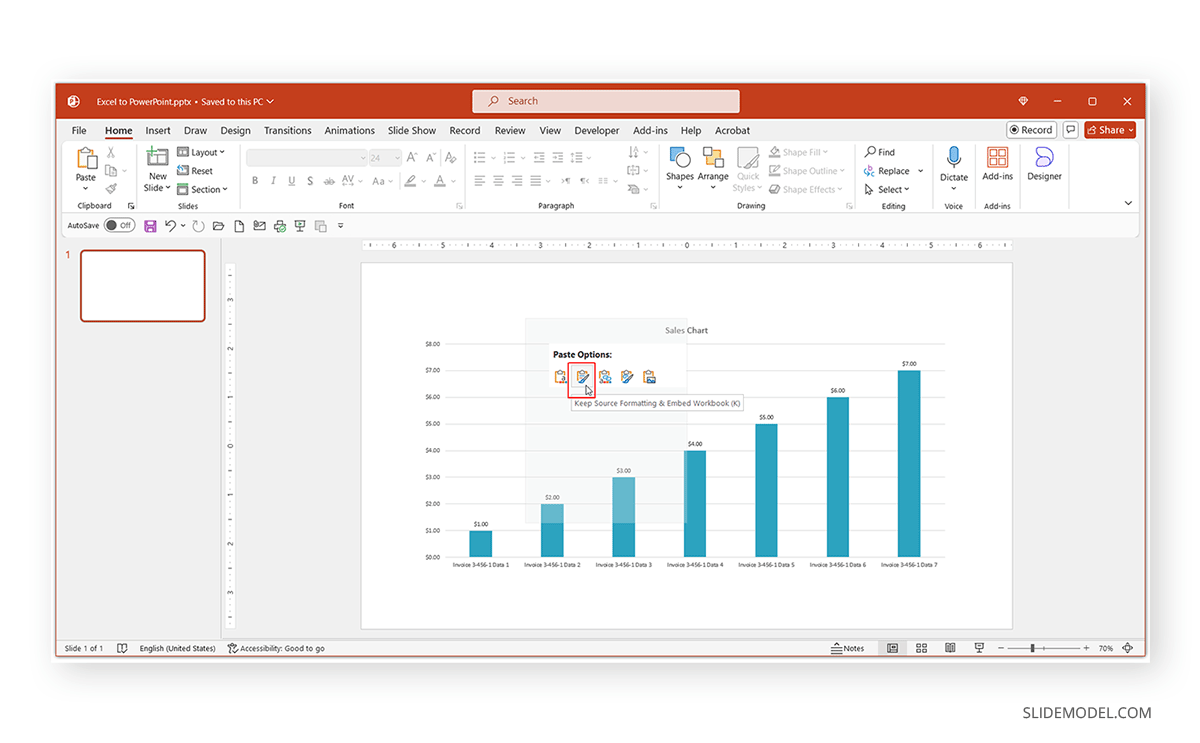
Keep Source Formatting and Embed Workbook
This option can help you keep the Excel chart’s original formatting when pasting and linking it to a PowerPoint file.
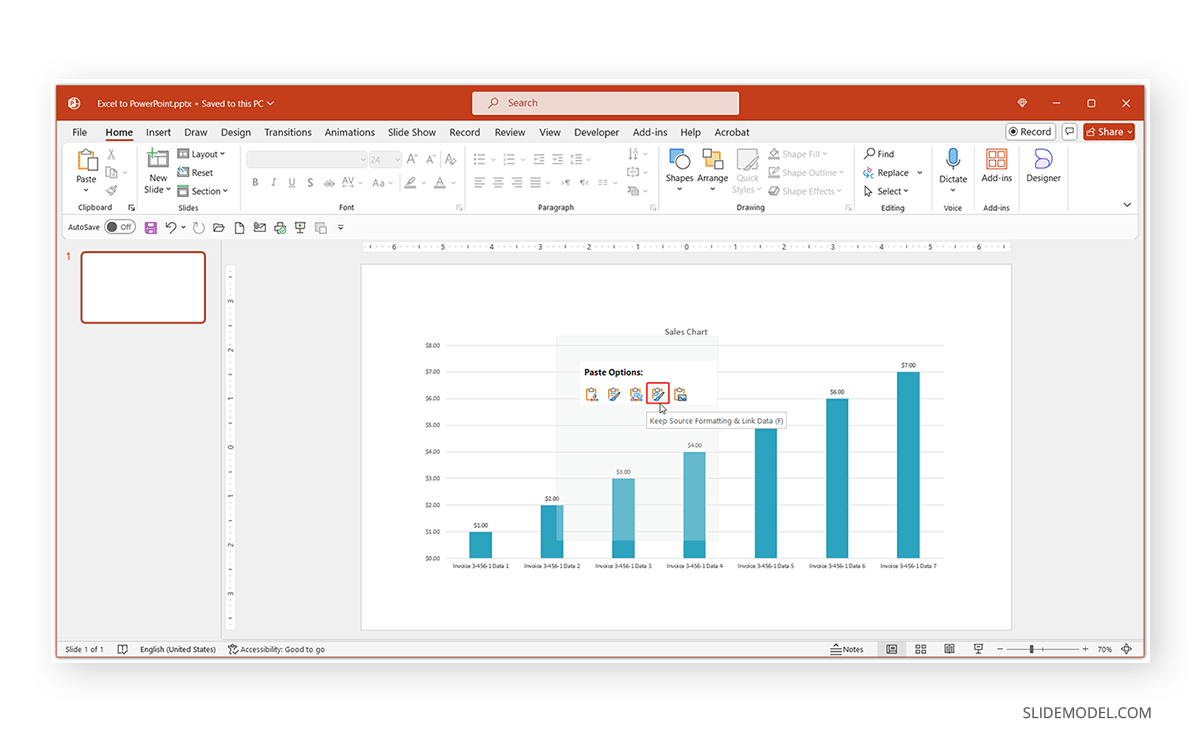
Use Destination Theme and Link Data
This will paste the Excel chart to PowerPoint while retaining the PowerPoint theme. The difference between this and the first option in the list is that data is pasted and linked in this option, whereas the first option embeds the data from Excel. Embedded data represents a snapshot of the source material, whereas data pasted is a copy of the content.
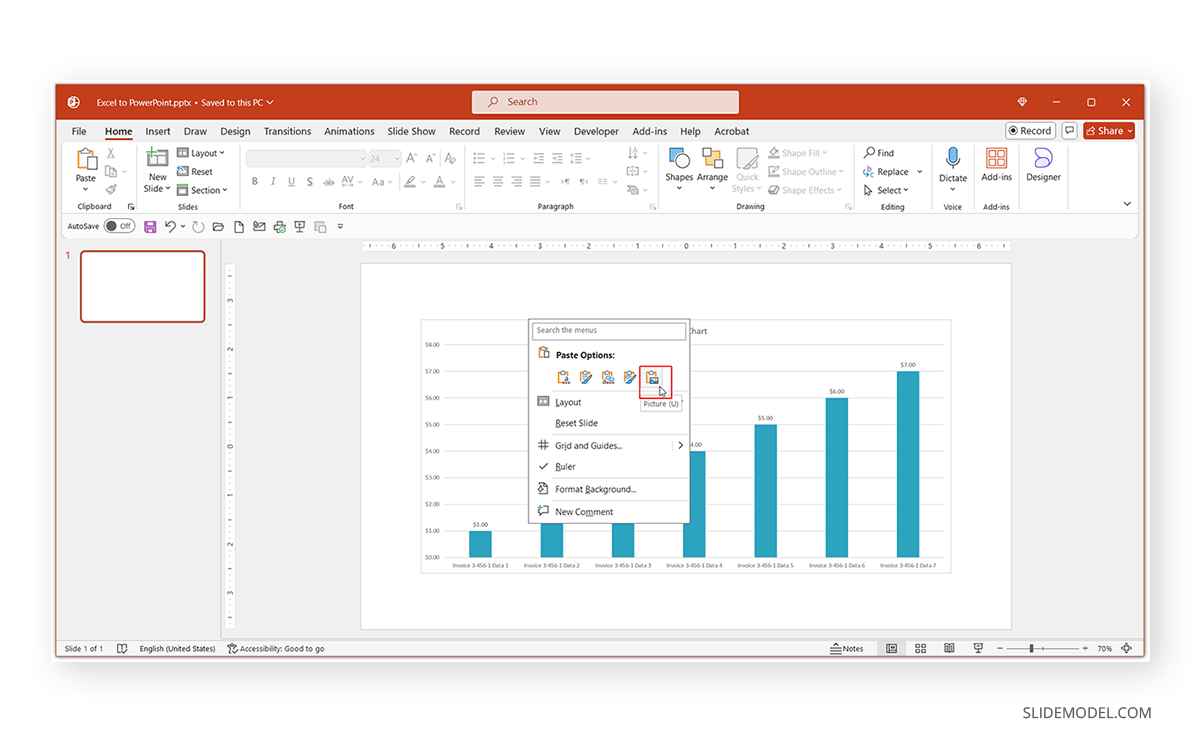
Paste as Picture
If you don’t want your data in linked or editable format, paste it as a picture in your PowerPoint slide.
How to Link Excel Data to PowerPoint Slides
There are different ways to link data in PowerPoint. This includes tables, charts, and entire spreadsheets that can be added to PowerPoint files. The methods below essentially answer the pressing question that many people new to Excel and PowerPoint ask: How do I make an Excel spreadsheet fit in PowerPoint?
How to Link Tables from Excel to PowerPoint
There are different ways to link tables from Excel to PowerPoint. The best option is to embed it in PowerPoint. You can do this by copying the table from Excel and using the Embed option to paste it. This will allow you to access the editable Excel file via Worksheet Object from the right-click context menu.
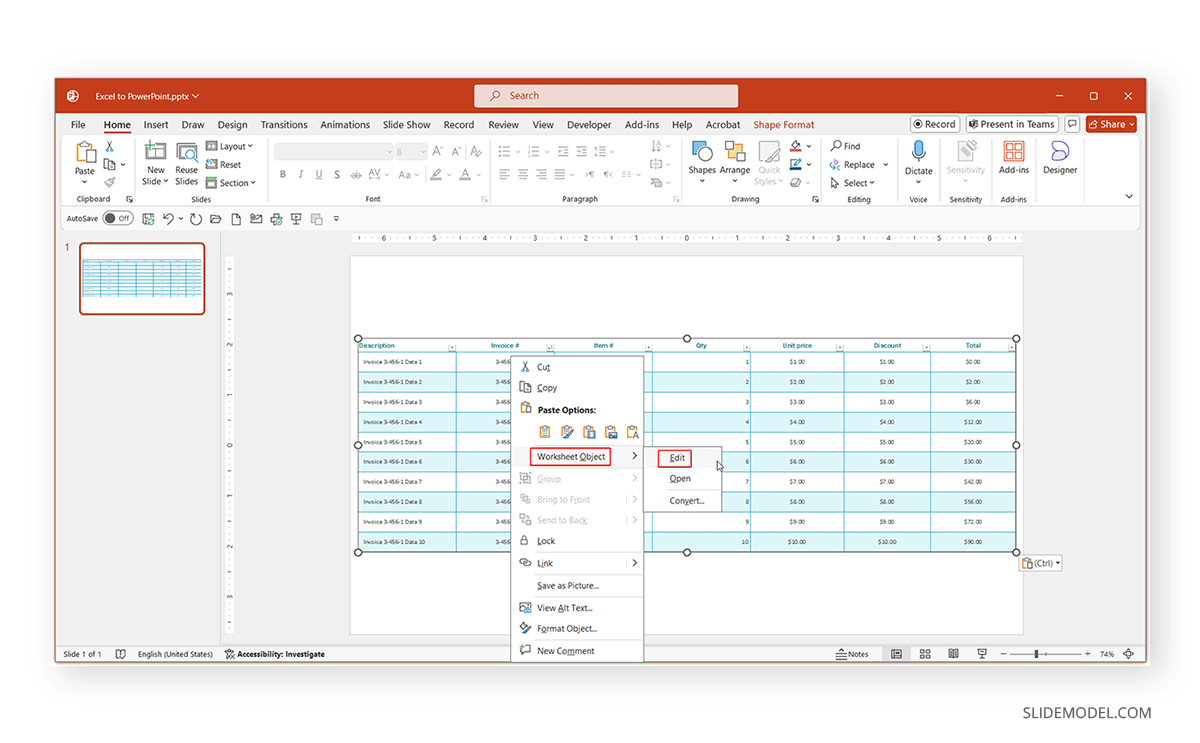
You can open the editable Excel file linked to the PowerPoint table anytime using the Worksheet Object option.
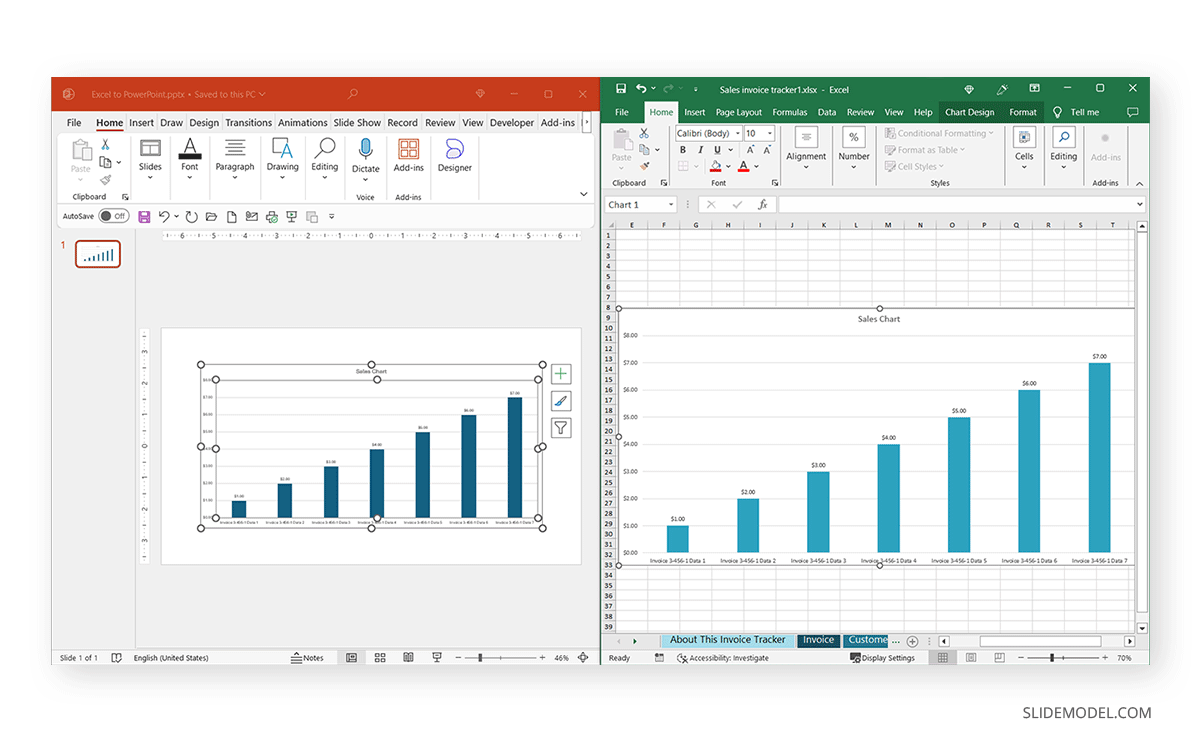
How to Link Charts from Excel to PowerPoint
When pasting charts from Excel to PowerPoint, you get a number of options to link the chart by linking and pasting it with source or destination formatting or embedding it in PowerPoint. You can use either of these options to ensure that you can later open the chart data for editing via the right-click context menu.
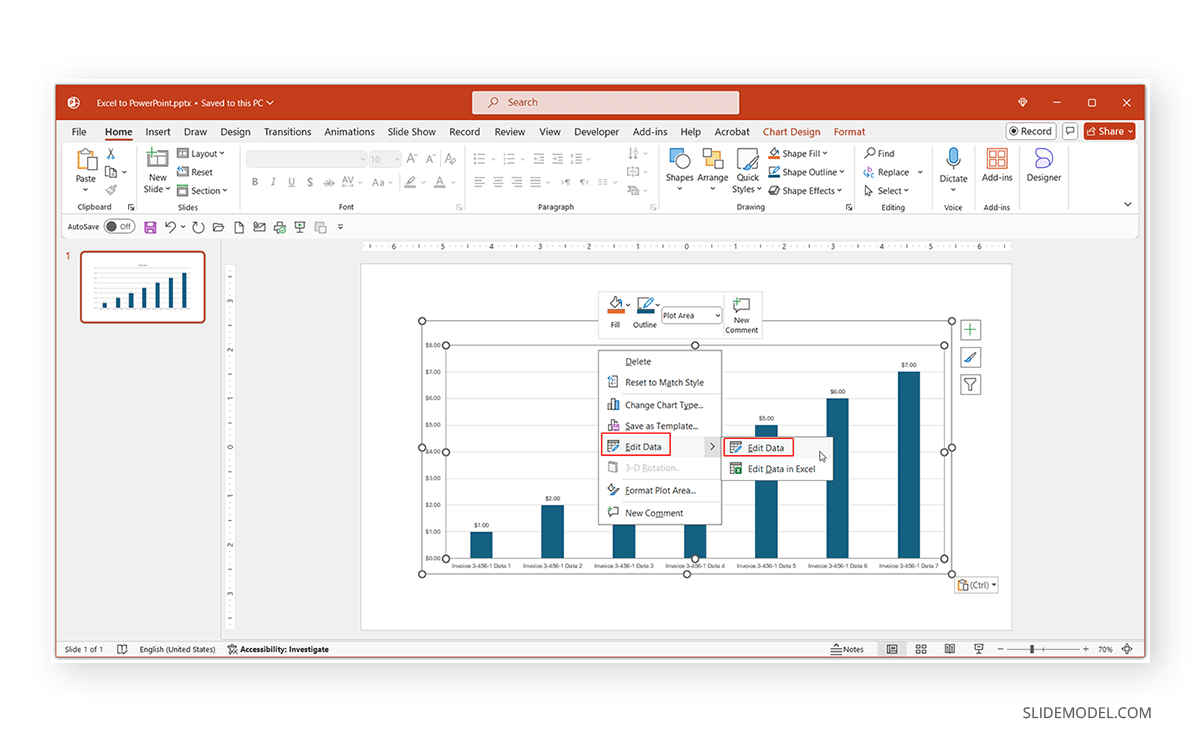
Once you open the Excel spreadsheet linked to the chart in PowerPoint, you can open the data from the original spreadsheet.
How to Link Excel Files as an Object in PowerPoint Slides
Excel data can often be too big for a PowerPoint presentation. You might be unable to show all the data in a single or a few slides. In such a case, you can link the spreadsheet in PowerPoint.
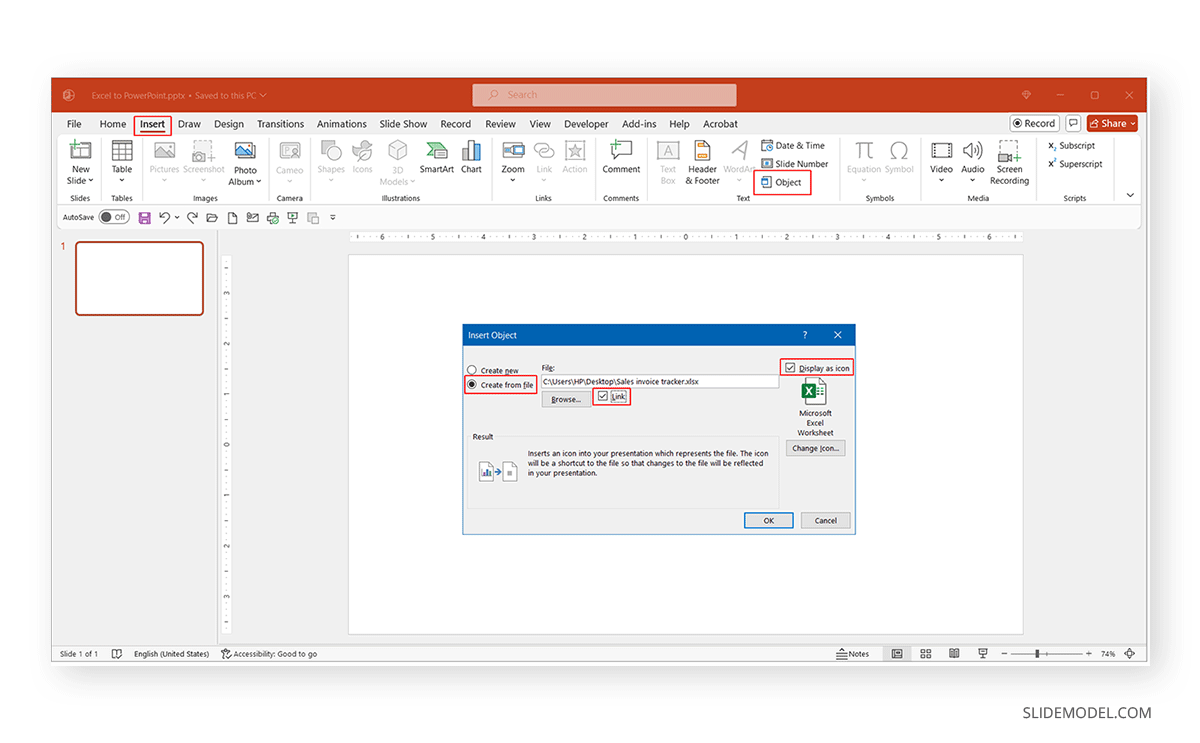
To link an Excel file as an object in PowerPoint, go to Insert -> Object -> Create from File and select the file to link from your device. Make sure the Link checkbox is enabled when linking the file.
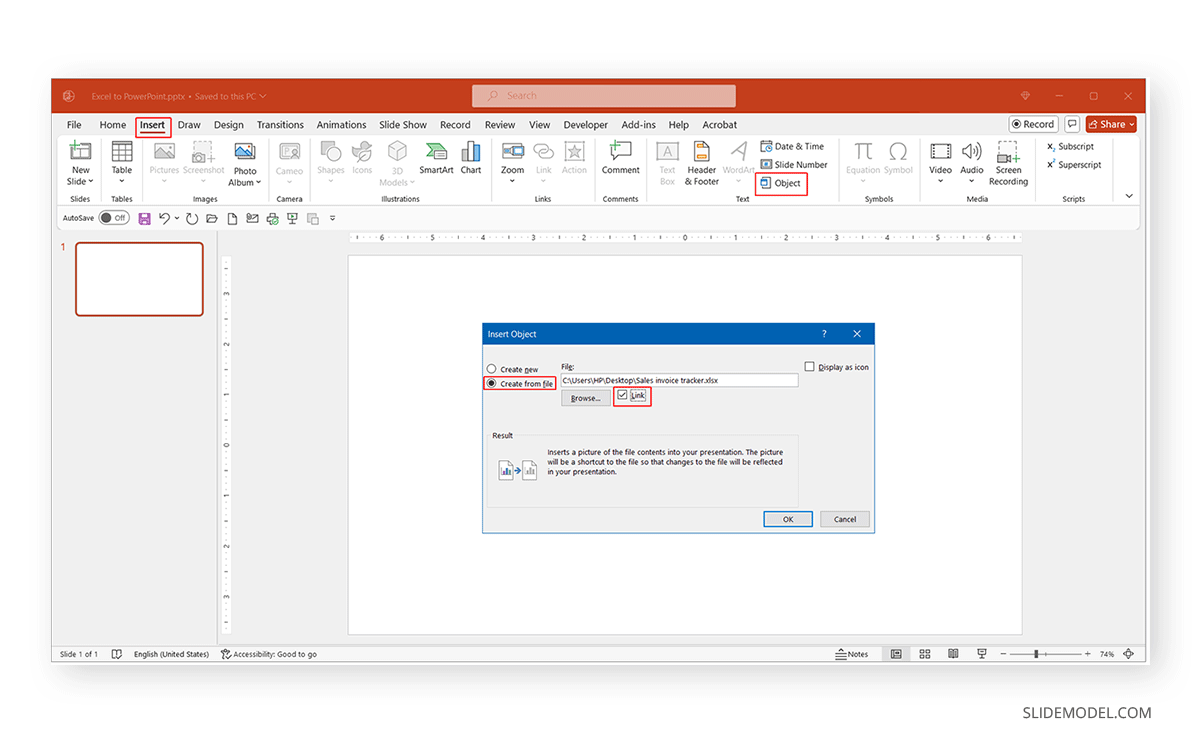
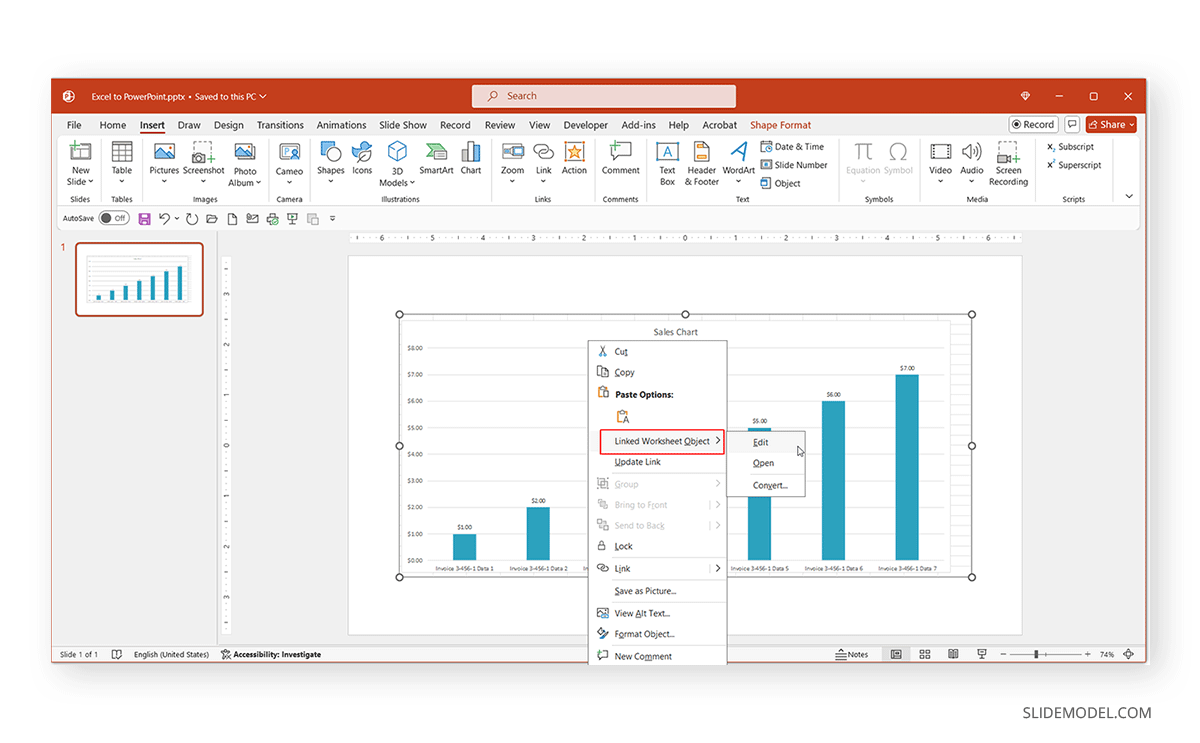
This will add a preview of the data in PowerPoint. You can open the entire spreadsheet anytime via the Linked Worksheet Object option by right-clicking on the preview or double-clicking on it to open the Excel file. In the example below, we linked a sales tracker spreadsheet to PowerPoint, and one of the charts in the file was the preview for the linked object.
Another method for linking the object to PowerPoint from Excel is to link it as an icon. In such a case, go to Insert -> Object -> Create from File and select the Excel file from your device. Make sure the Link and Display as Icon options are checked before you hit OK.
This will link the Excel spreadsheet as an icon on your PowerPoint slide. You can open the file anytime using the Linked Worksheet Object option via the right-click menu or double-click to open the Excel file.
Related: You might also be interested in our tutorials on creating hyperlinks in PowerPoint and Google Slides and embedding HTML in PowerPoint.
What are the Pros and Cons of Linking an Excel File to PowerPoint
Linking an Excel file to PowerPoint has various pros and cons. A few of these are listed below.
Pros
- No Need to Recreate Data: You can link your spreadsheets, charts, and tables to connect Excel data to PowerPoint without manually recreating it in PowerPoint.
- Automatically Update Data: You can automatically update slides by linking data from Excel to PowerPoint.
- Data Consistency: Your data can appear consistent when linked from an existing spreadsheet in Excel.
- Avoiding Errors: There are fewer chances for errors when linking to existing data from Excel than when recreating it in PowerPoint.
- Ability to Show Large Data: You can link Excel spreadsheets to PowerPoint and open them during a presentation to show large chunks of data directly from Excel. This is more practical than spending time making complex PowerPoint slides that might not be adequate to showcase several rows and columns of data effectively.
- Time-Saving: Linking data saves time compared to making lengthy slides from scratch containing critical information that might already exist in Excel files.
Cons
- File Dependency: Excel files that are moved, renamed, or deleted can become unlinked, causing data loss. This makes the added content dependent on the linked file.
- Complexity: maintaining data linked to source files can be complex, and the chances of errors and mistakes in maintaining data can be high.
- Sharing Issues: It can be difficult to share slide decks with linked files, and presentation files that contain data from Excel are also difficult to share.
- Backup Issues: Maintaining backups of Excel files can be cumbersome to ensure PowerPoint files remain viable.
- Lack of Perspective: Large chunks of data linked from Excel can be too complicated for a simple presentation explanation, making it difficult to provide proper context tied to the topic.
PowerPoint Templates for Showcasing Data from Excel
While you can add charts, tables, and embed spreadsheets as objects in PowerPoint, below are some recommended PowerPoint templates that can help you showcase your Excel data in presentation slides.
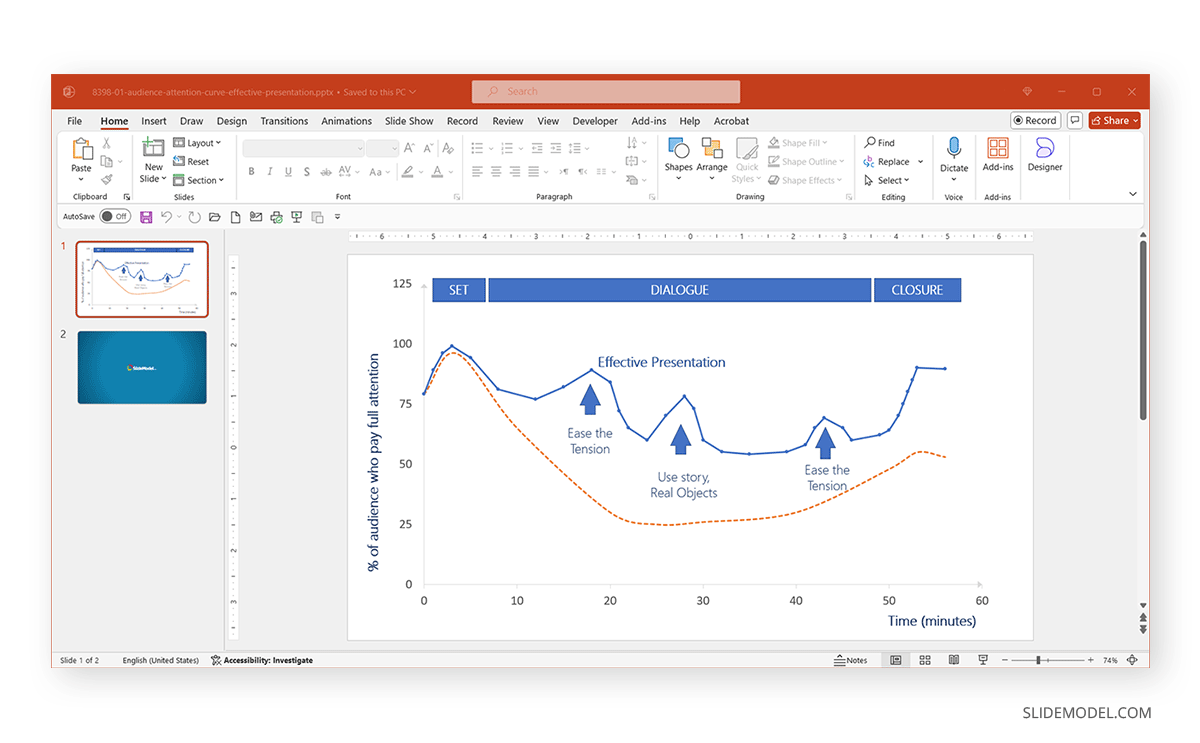
Audience Attention Curve Effective Presentation
This presentation template showcases the audience attention curve based on the same-name theory. It provides a guideline regarding how the audience remembers a presenter and allows you to edit the sample chart to create a data-driven presentation.
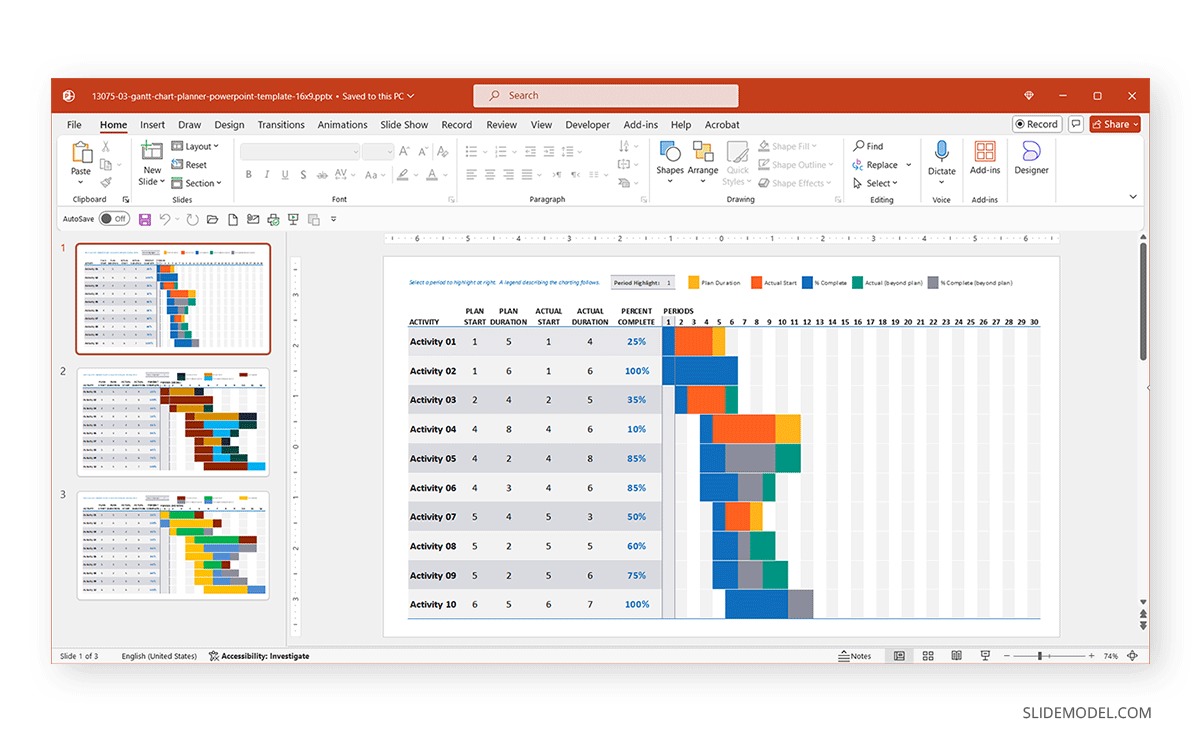
Data Driven Gantt Chart PowerPoint Templates
Gantt charts are commonly used in project management, and this template provides three Gantt chart designs linked to Excel worksheets that you can edit to customize and update the sample Gantt charts in this template.
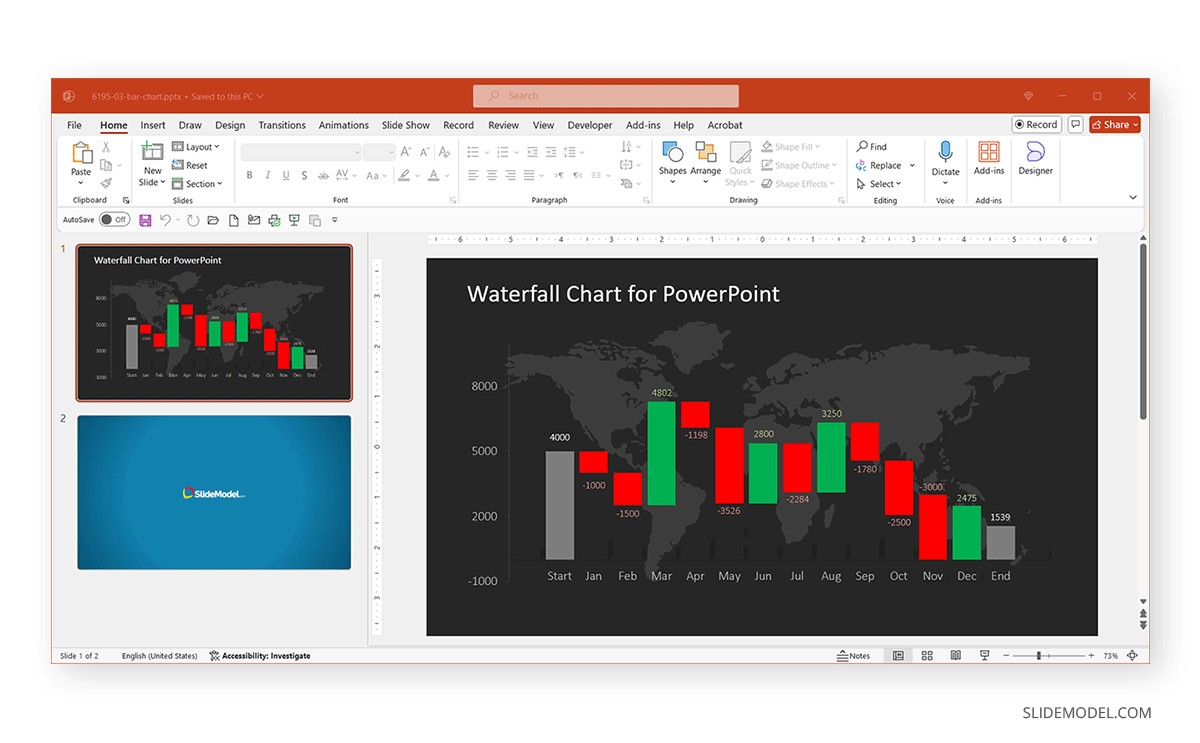
Data Driven Waterfall Chart for PowerPoint
With a colorful, editable waterfall chart, this template has a single-slide design that can be customized to make a waterfall chart in PowerPoint. You can customize the chart colors and link sample data to create a professional-looking waterfall chart.
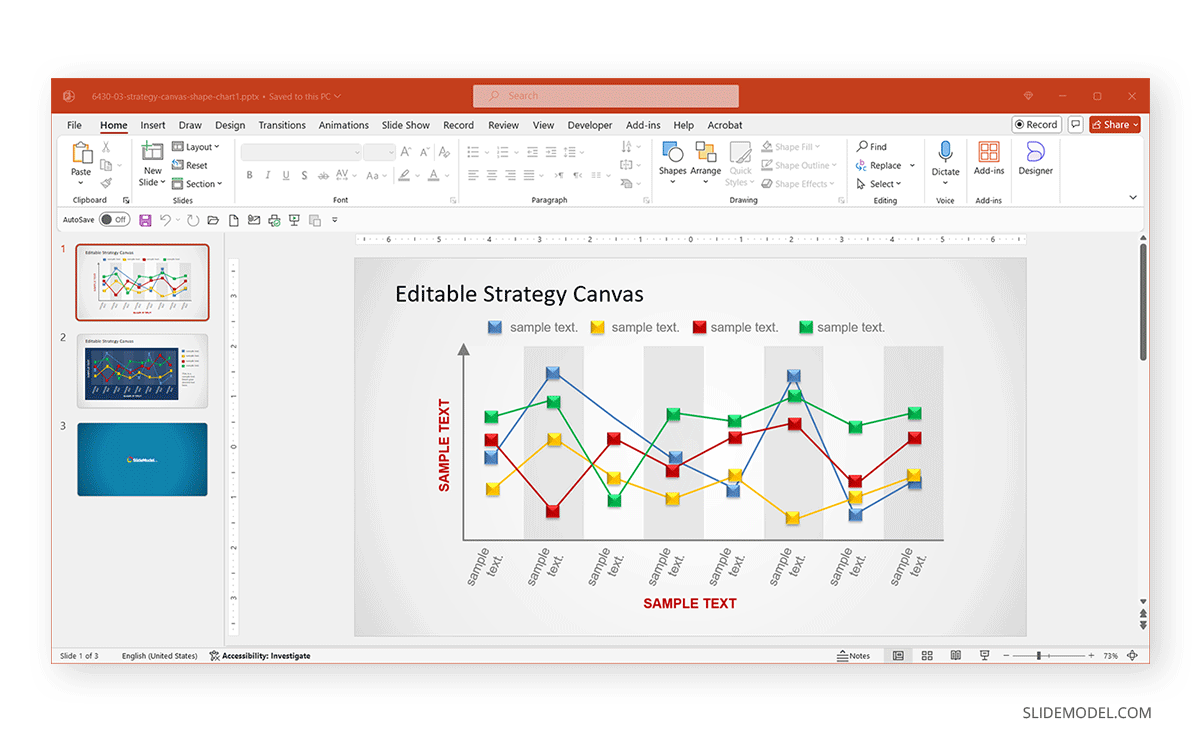
Editable Strategy Canvas PowerPoint Template
While not directly linked to Excel data, this template showcases the Strategy Canvas tool using PowerPoint shapes as the design elements for the two unique designs in the template. According to the Harvard Business Review, if the employees closest to customers, who are also responsible for operating the processes that create value, don’t know the strategy, the organization cannot bank on them to implement it. This is why a Strategy Canvas as a diagnostic tool is so important.
You can use this template to edit the sample charts to create and present your own strategy canvas and discuss such essential aspects of your organization with the help of professional sample designs that are easy to customize. For more complex designs, see our tutorial about how to insert 3D model in PowerPoint.
Final Words
While many PowerPoint newbies might be concerned with fundamental questions such as how to start a presentation and how to end a presentation, as their skills improve, they will be looking for more complex presentation ideas, such as making Excel spreadsheets workable with PowerPoint files. In such a case, copying data from Excel to PowerPoint or embedding it as an object can be a practical way to minimize the time needed to make large chunks of data accessible to present by inserting an Excel file in PPT.
Other handy tricks can make your presentations a lot more engaging. Therefore, you might find our tutorials about how to insert a video into PowerPoint, how to embed a Youtube Video in PowerPoint, how to insert a PDF into PowerPoint, and how to insert a Word document into PowerPoint as valuable tips for making the most out of your presentations.