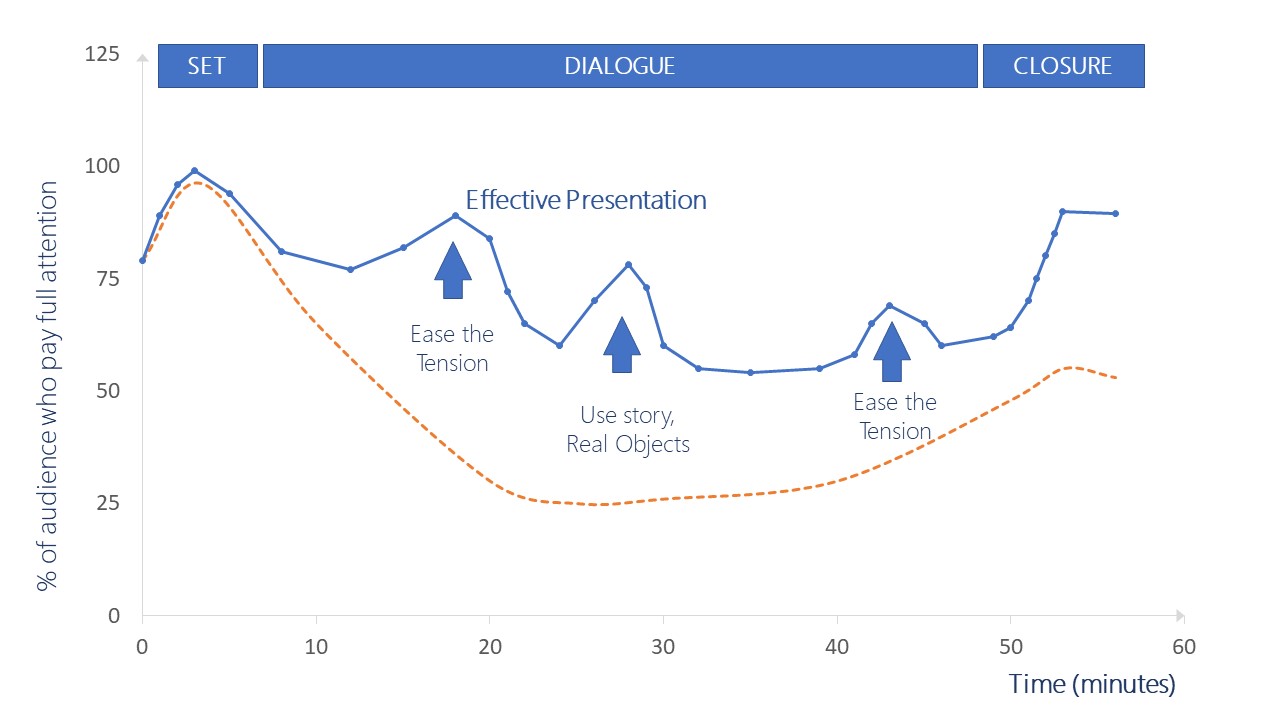
Audience Attention Curve Effective Presentation
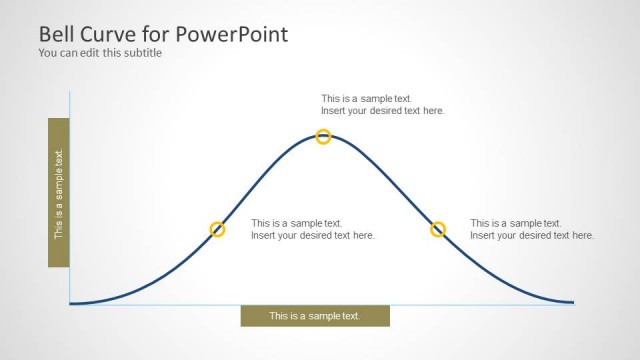
The Audience Attention Curve Effective Presentation is a productive PowerPoint for speech guidelines. This template is based on audience attention curve theory. The template describes how audience of an ordinary presentation will likely remember from presenter’s message. And the goal is to effectively deliver that message. This PowerPoint template of attention curve demonstrates a communication chart. It could be used as a learning PowerPoint to educate individuals about different strategies for effective presentation delivery. The curved chart of audience attention will allow professionals to prepare techniques in order to engage audience throughout presentation.
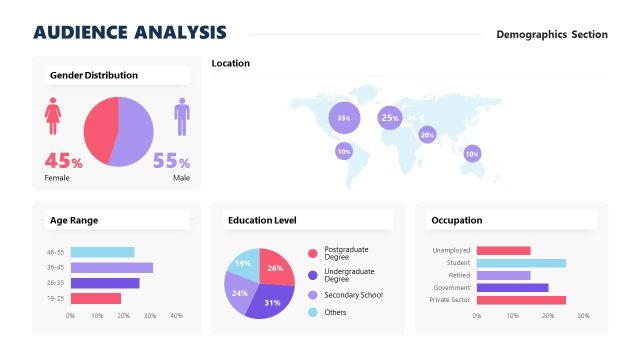
The Attention Curve PowerPoint provides a visual illustration of presentation engagement graph i.e. higher in beginning and during conclusion. Since many people are easily distracted that they tune in and out of presentation. The second data distribution chart in graph slide displays techniques to elevate viewer’s engagement during dialogue. These are the communication techniques based on principle to deliver a memorable and successful presentation. The graphic of effective presentation includes three segments of elevation i.e. ease the tension, use story, and real objects. These presentation strategies will enable audience to listen to all facts, figures, and examples. The dramatic and lively statements, questions, speaking slowly and clearly, etc. are few presentation perfecting techniques.
The Audience Attention Curve Effective Presentation is a single slide layout of data drive graph chart. This PowerPoint template is linked to an excel data file that reflects values on graph. Users can change these data values in excel sheet which will update audience attention curve. Similarly, users can change communication techniques in audience attention curve based on type of viewers. For instance, multiple intermediate conclusions before final wrap-up.
IMPORTANT: The chart is created using an Excel data driven chart. If you want to change the chart with your data, just download the excel file in this product and edit the file link in the PowerPoint file (menu File>Info>Related Documents. If you have any issue to complete this procedure, please contact us and our support team will help you through the process.
You must be logged in to download this file.
DOWNLOAD- Category
- Data & Charts
- Rating


 Loading...
- Size
- 16x9
- Item ID
- 8398-01
- Colors
Subscribe today and get immediate
access to download our PowerPoint templates.