Data-driven presentations require interpreting information in visual form. One of the most commonly used methods to do this is in the form of tables. Making and formatting tables in PowerPoint is simple. However, making subtle changes can be tricky, as many struggles to understand formatting options. This is regardless of when making new tables or using PowerPoint templates with existing tables. Below is a quick overview of how to create and format tables in PowerPoint.
How to Create a Table in PowerPoint
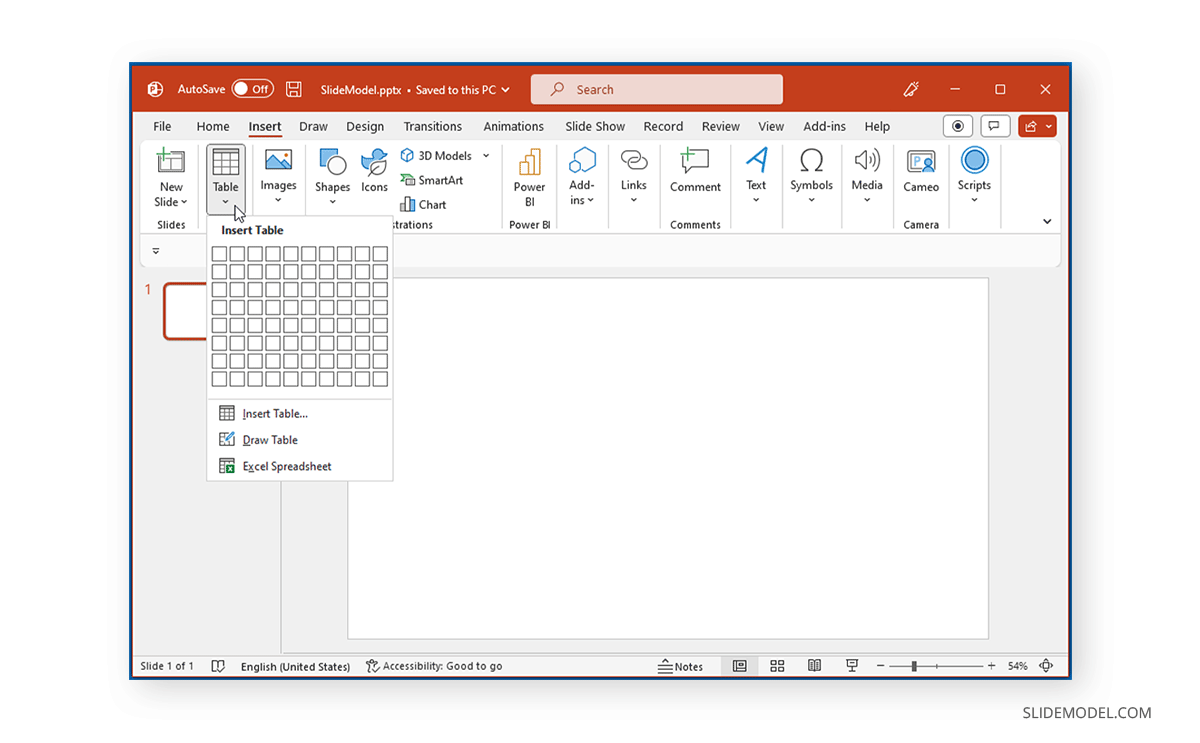
To create a new PowerPoint table, go to the slide you want to add the table to and add a table to the slide via Insert -> Table. This will provide you with multiple options for making tables.
Select Rows and Columns using Drag and Drop
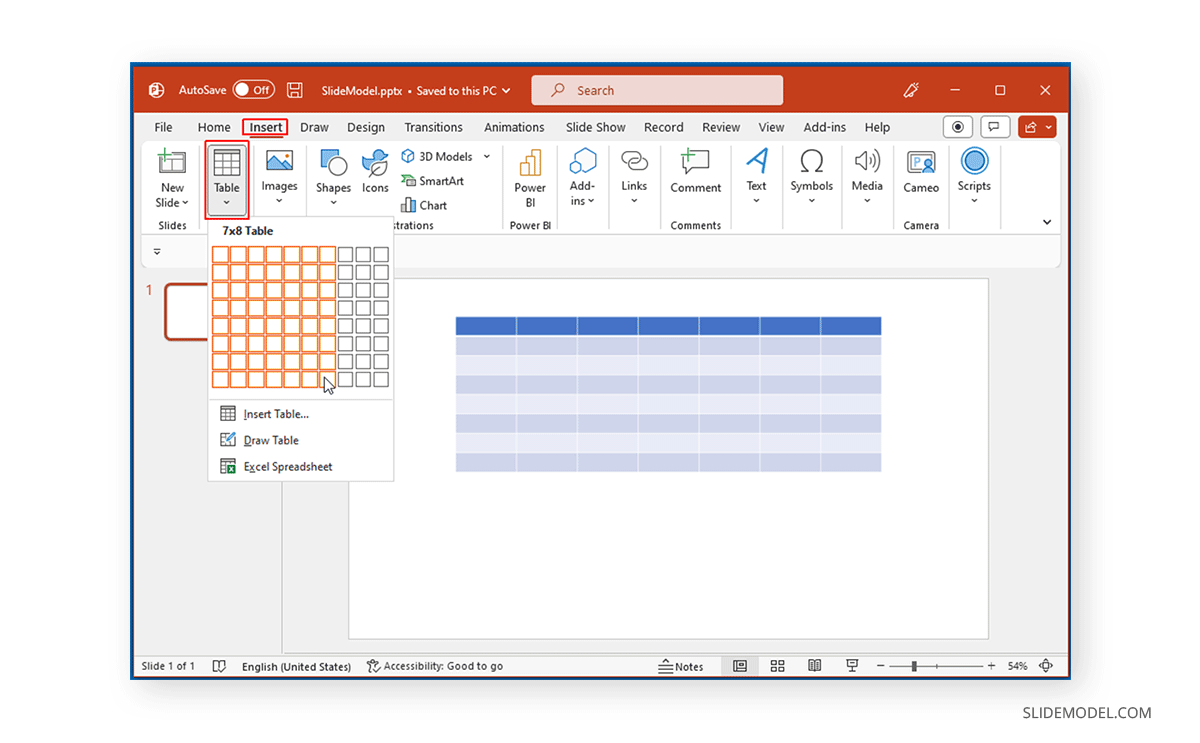
You can create a table by selecting the number of rows and columns from the drag-and-drop menu via Insert -> Table.
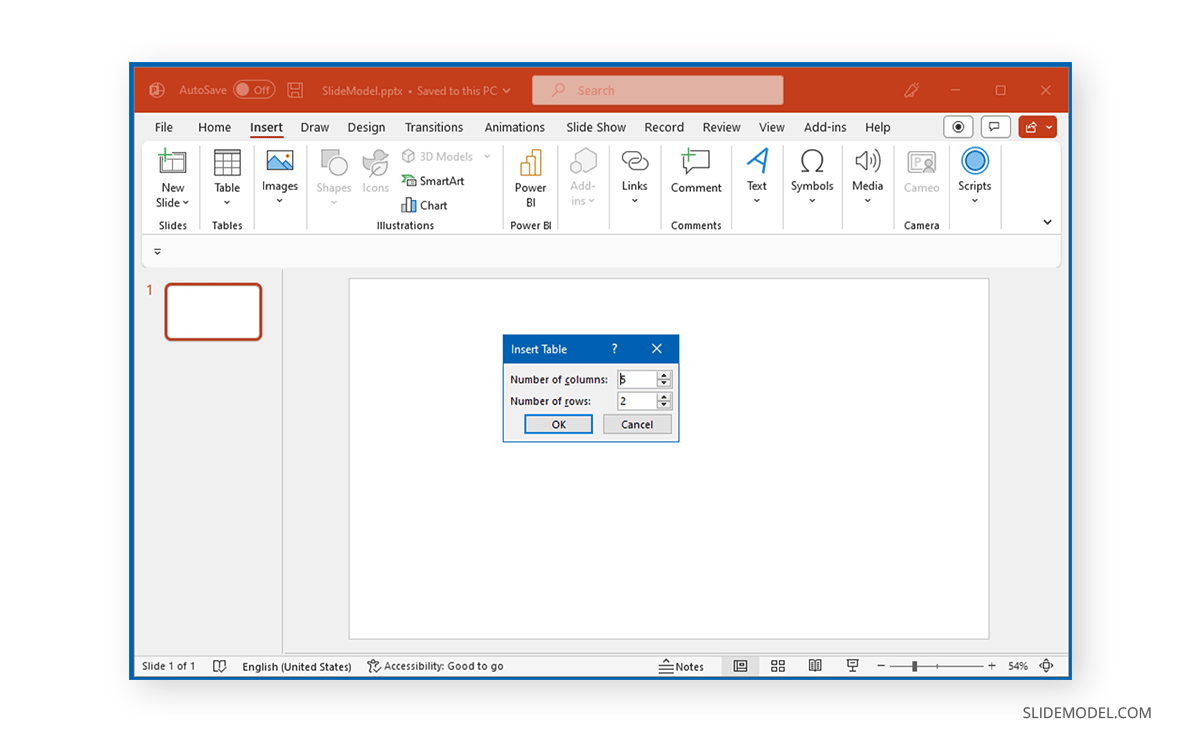
Specify Rows and Columns to Add
You can also add a table by specifying the exact number of rows and columns via Insert -> Table -> Insert Table.
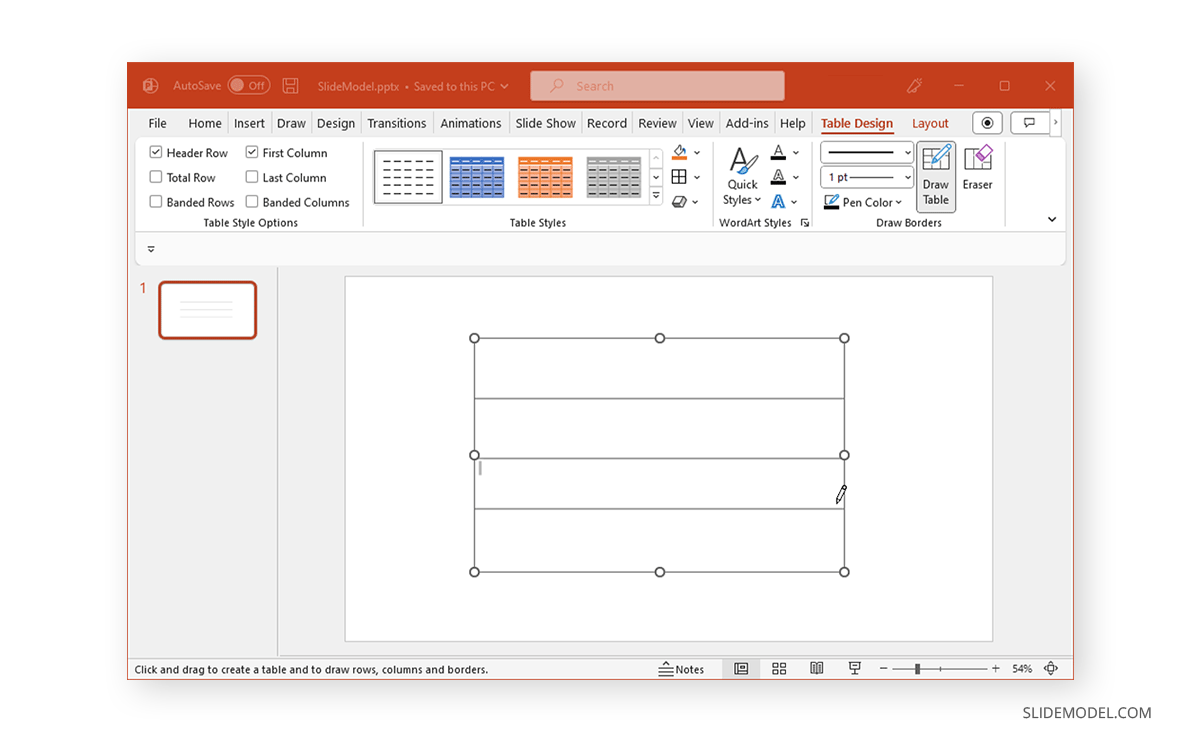
Draw a Table
To draw a table to create it in the current slide, go to Insert -> Table -> Draw Table. Once a table has been generated, you can make further edits to a drawn table via the Layout tab. For example, you can draw borders, and erase sections.
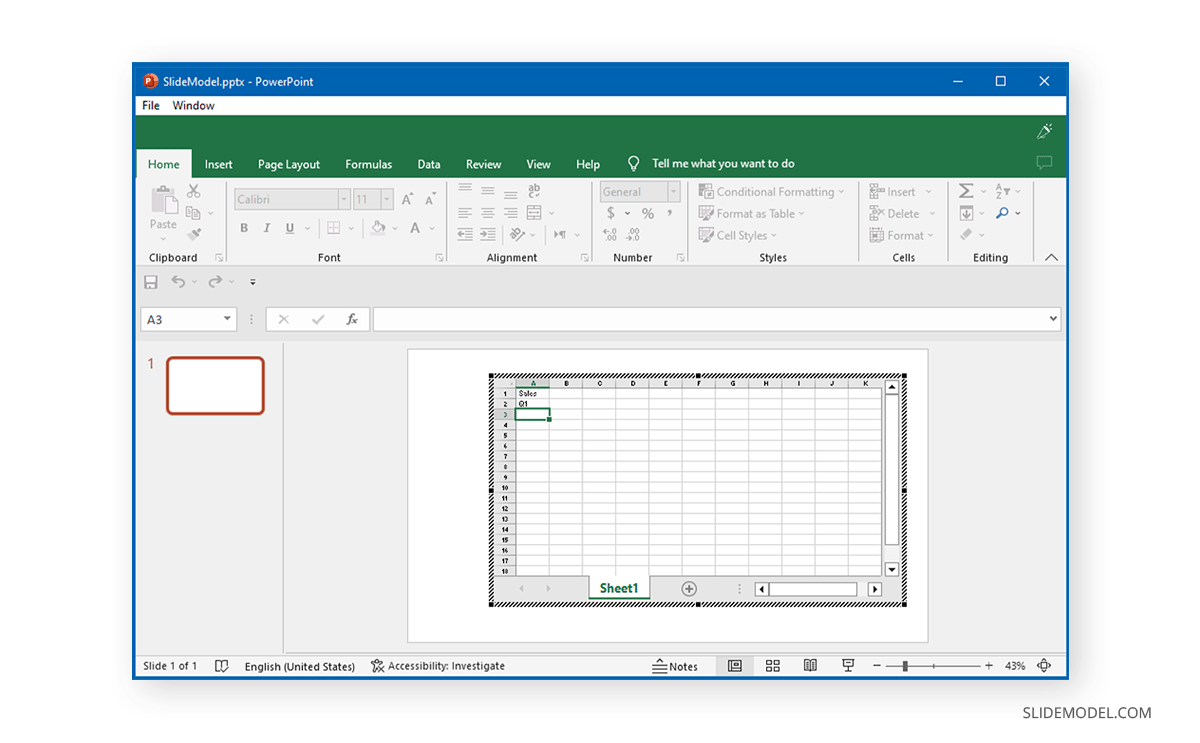
Create a Table from an Excel Spreadsheet
To create a table from an Excel spreadsheet, go to Insert -> Table -> Excel Spreadsheet to enter data in an Excel spreadsheet to use in PowerPoint. An Excel spreadsheet will open where you can enter data for your table.
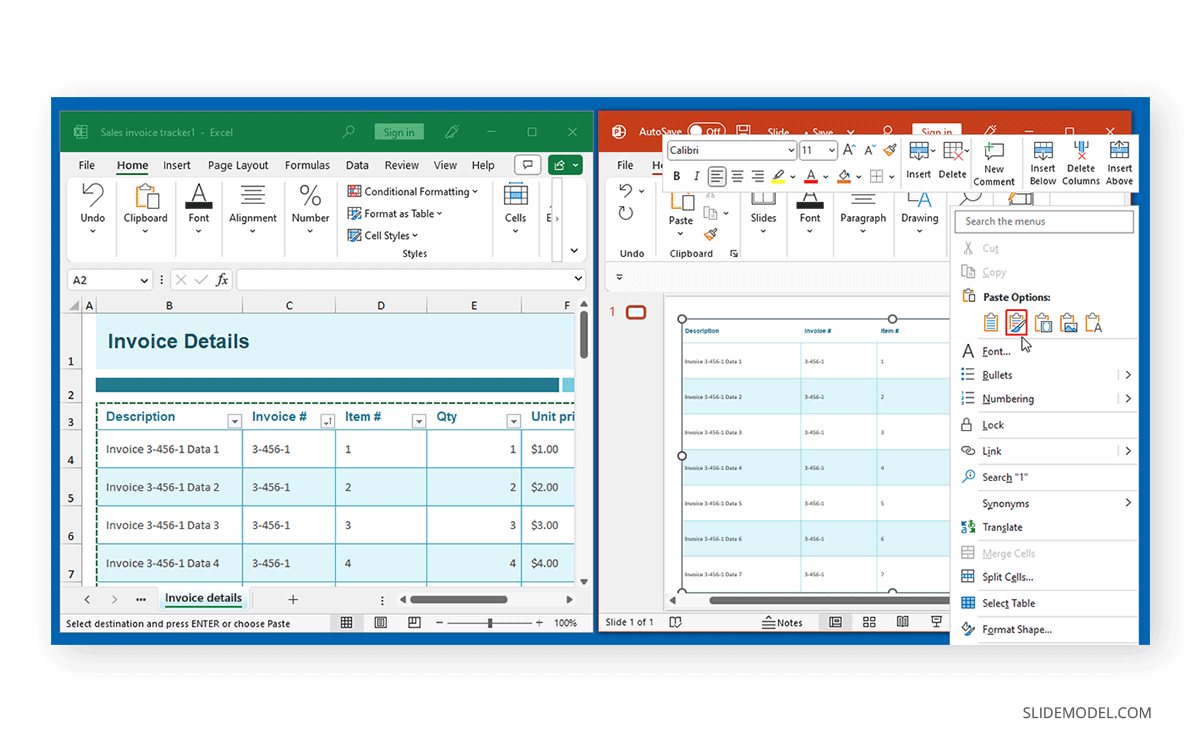
Copy and Paste a Table
You can also copy and paste a table directly from an Office app such as Word, Excel, or even another PowerPoint presentation.
How to Format a Table in PowerPoint
Various PowerPoint table formatting options can be found via the Ribbon menu.
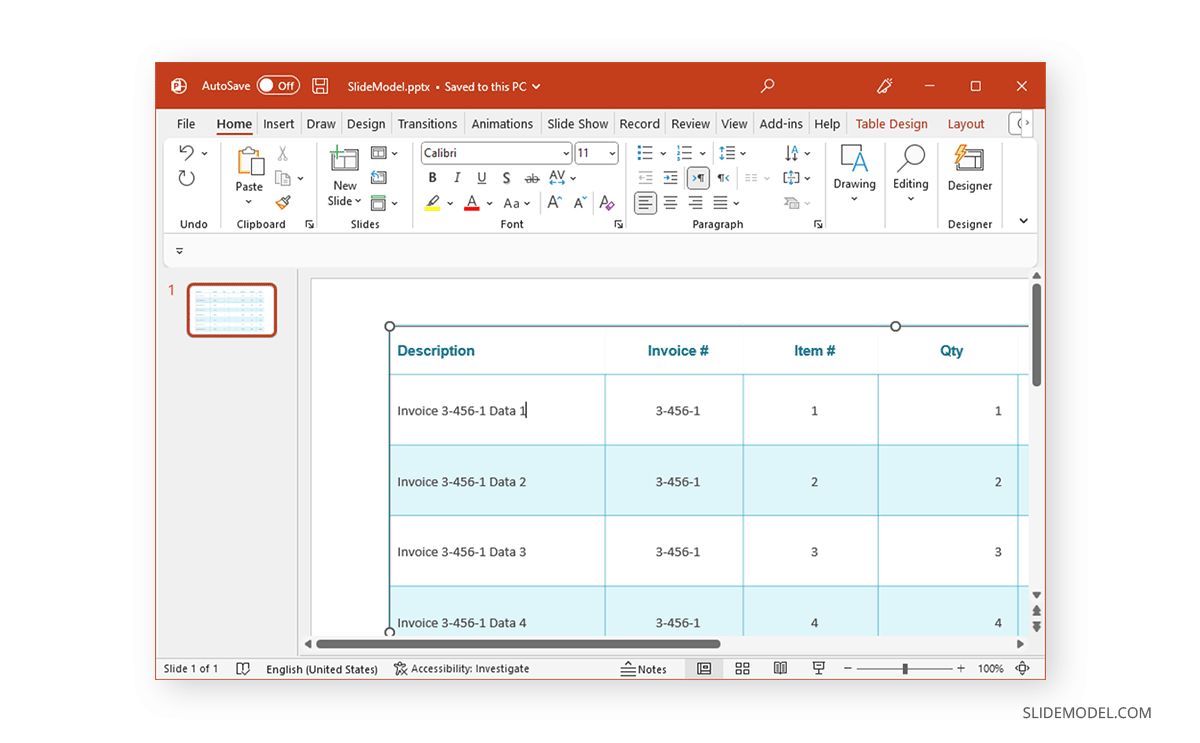
How to Enter Information in a Table
To edit or add data to a table in PowerPoint, simply click on the cells to enter or edit the required information.
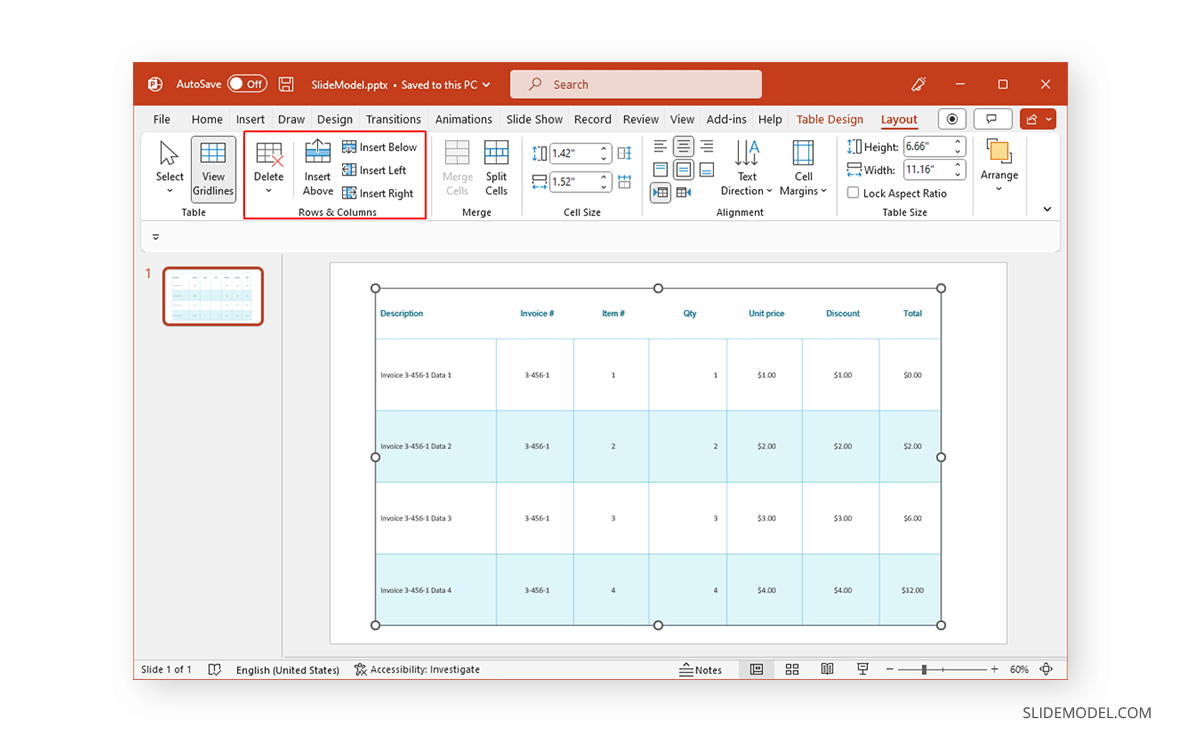
How to Add or Remove Rows and Columns
To add or remove rows and columns, head to the PowerPoint Layout tab. These options allow you to change the look of the table.
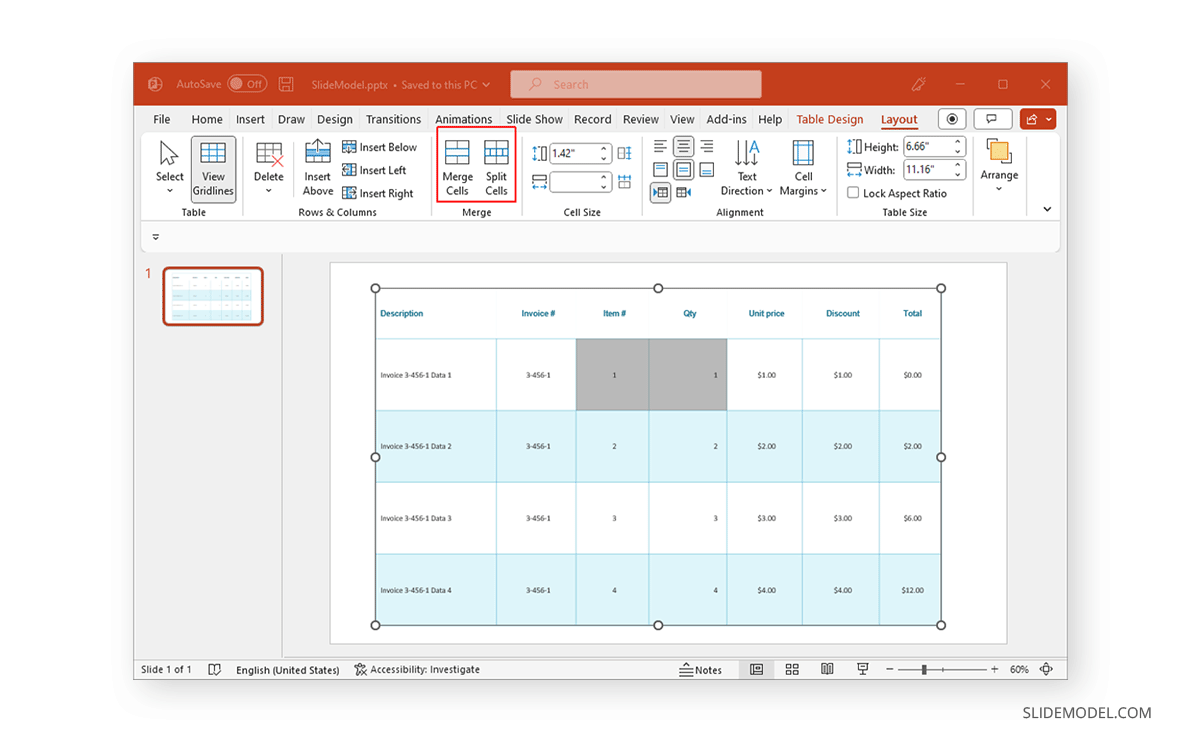
How to Split and Merge Cells in a Table
The Split Cells option in the Layout tab can be used to split cells. Similarly, you can select multiple cells to merge and use Merge Cells to combine them.
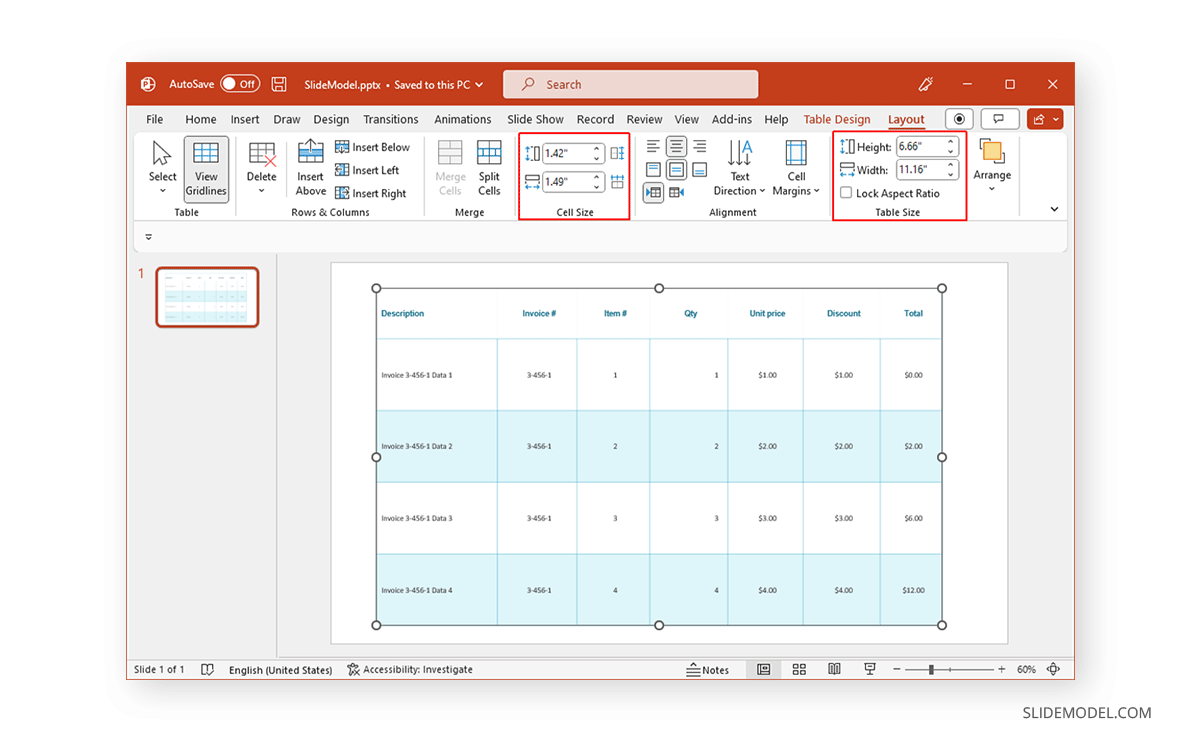
How to Adjust Cell Size and Table Size
The Cell Size menu in Layouts can be used to adjust the distribution of rows and columns, whereas Table Size enables adjusting the height and width. You can also check Lock Aspect Ratio to avoid accidental changes to your table size.
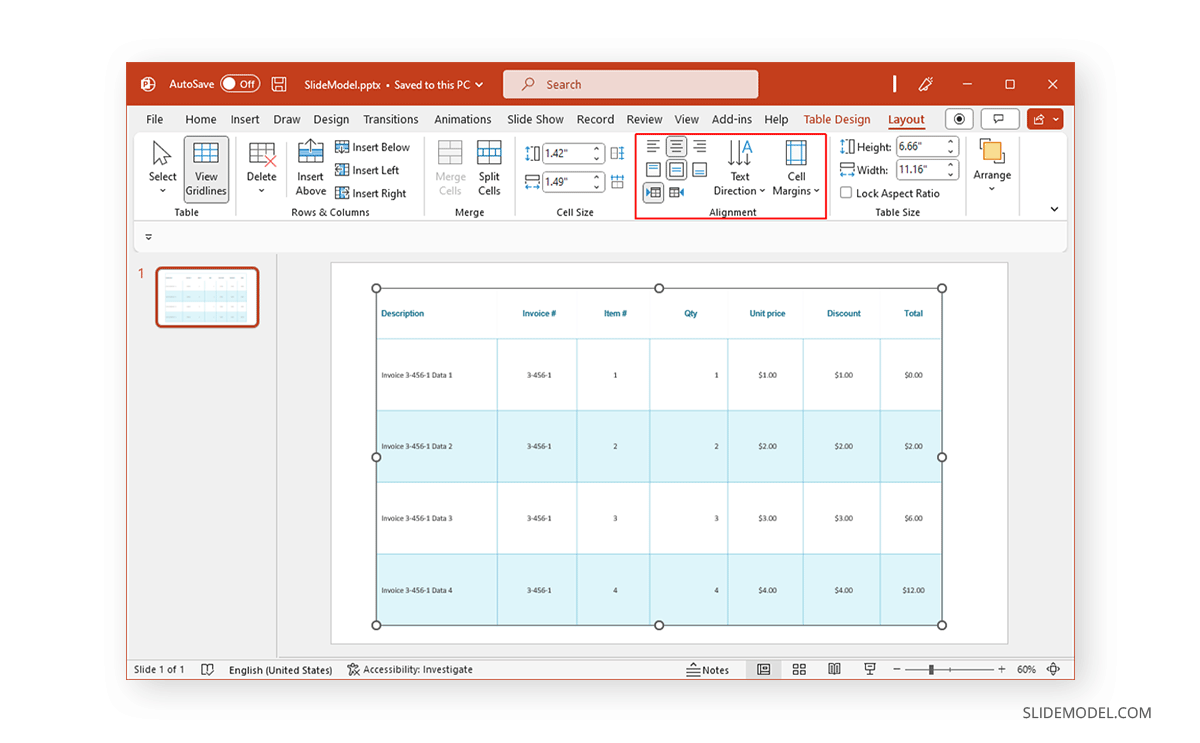
How to Align and Arrange a Table in PowerPoint
To align your table, the Layout tab provides alignment options that can be used to align the table to the left, center, or right, including options to set the left and right orientation for your table. You can manage the text direction and cell margins via the Alignment menu.
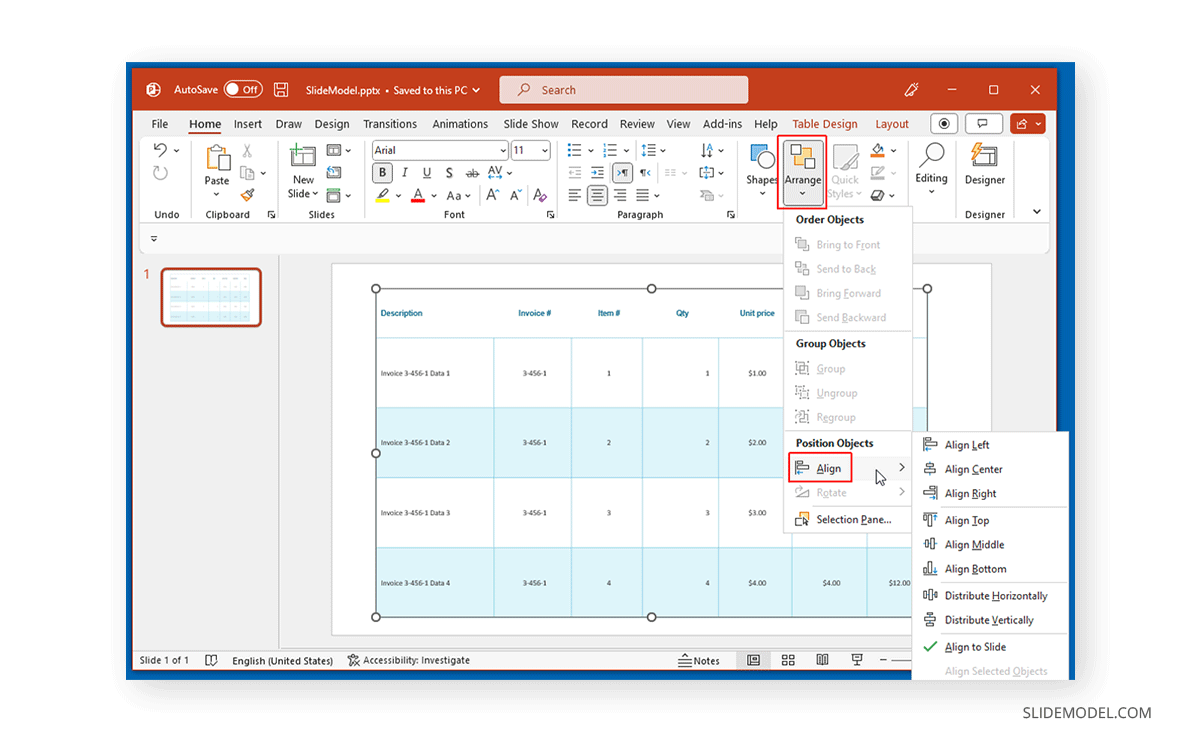
The Arrange menu also provides a list of alignment options that can be used to adjust your table on the slide. This includes placing your table to the right, left, center, top, middle, and bottom. You can also distribute the table vertically or horizontally.
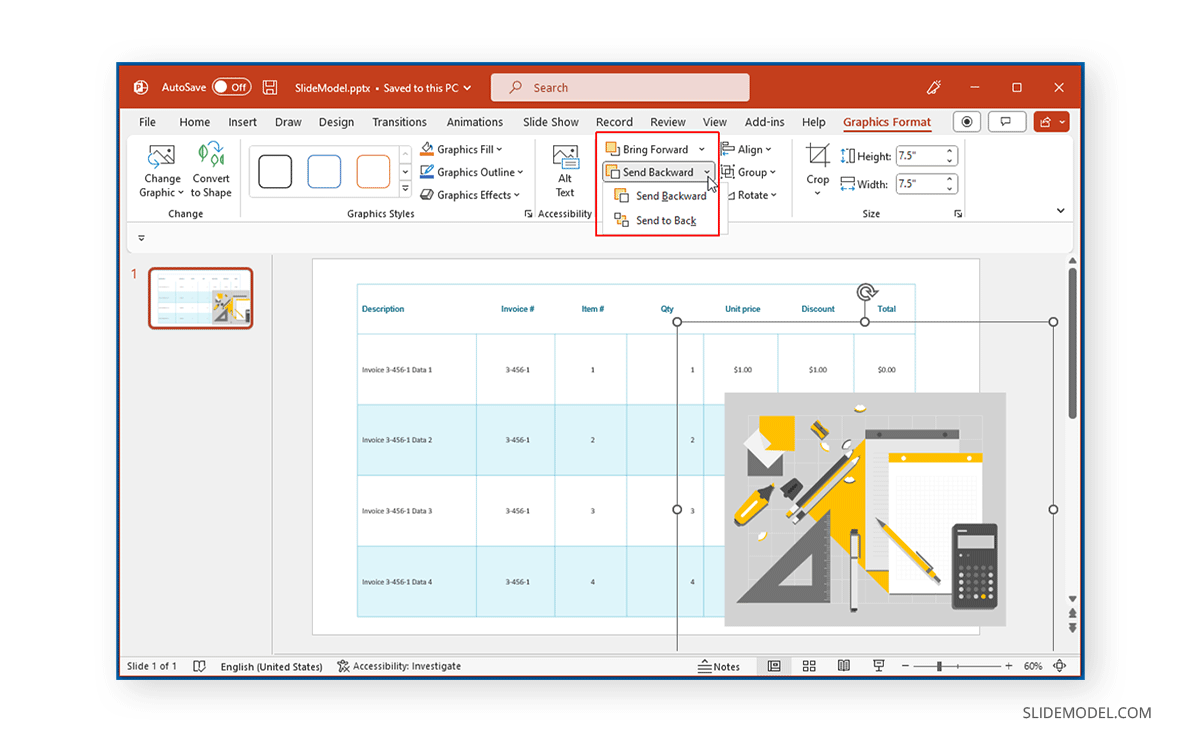
Sometimes, a PowerPoint template might have certain slide elements affecting your table’s appearance. In such a case, you can send slide elements a step backward or forward or send them to the back or front via the Arrange menu in the Layout tab.
How to Design a Table in PowerPoint
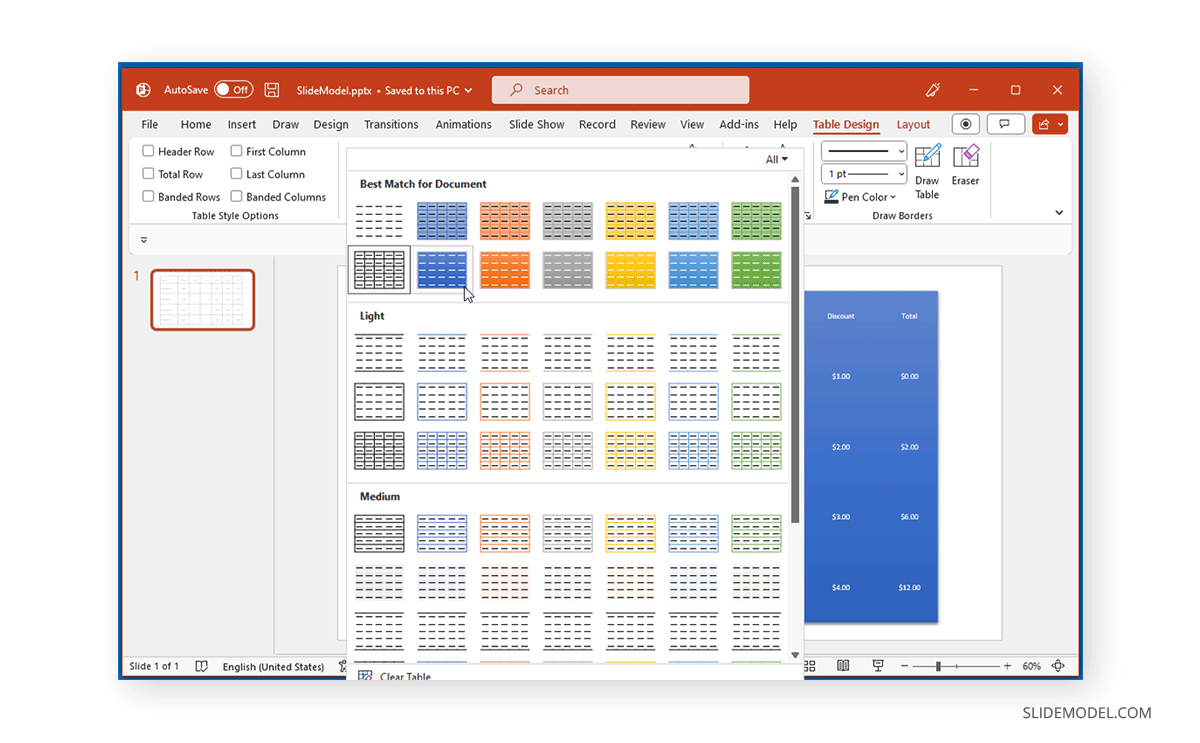
The Table Design tab provides all major design options you would need to make necessary adjustments to the table. Some of these options are also available via the Home tab. Table Styles is one of the most commonly used options to select a style for tables in PowerPoint.
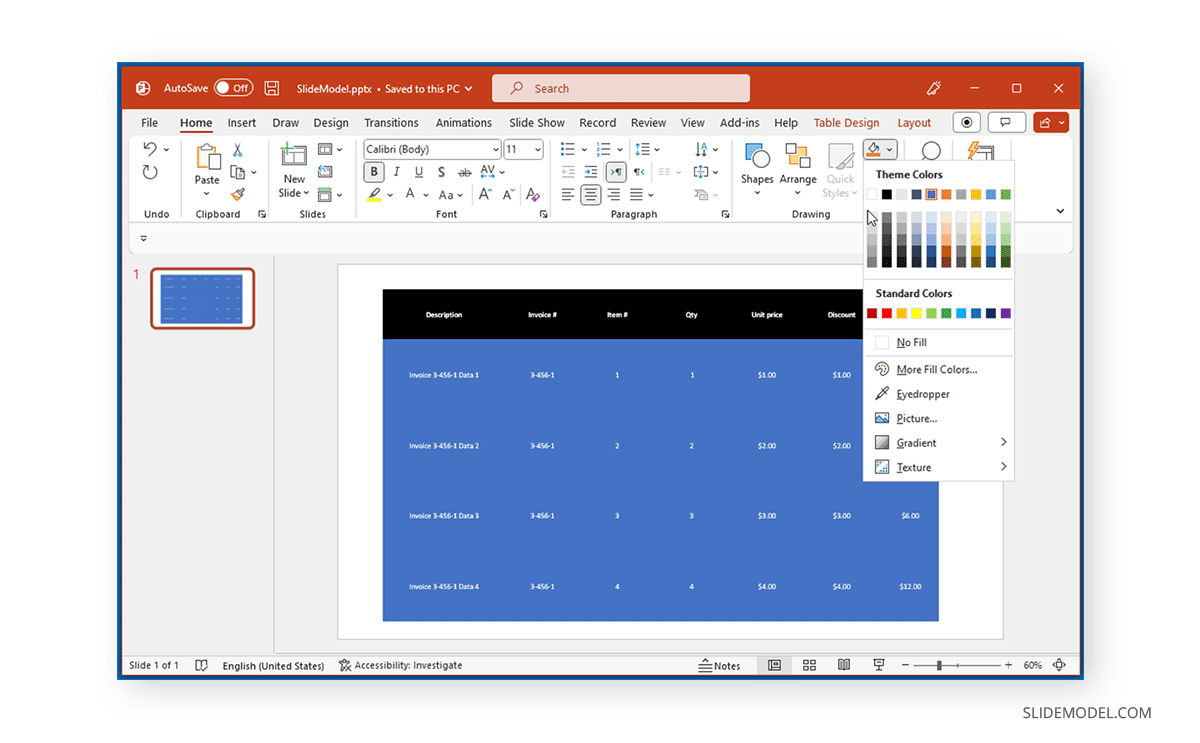
To make changes to the shading and borders or to add effects, see the options next to Table Styles. For example, you can remove borders for your table via Borders or use Shading to add a color shade of your choice.
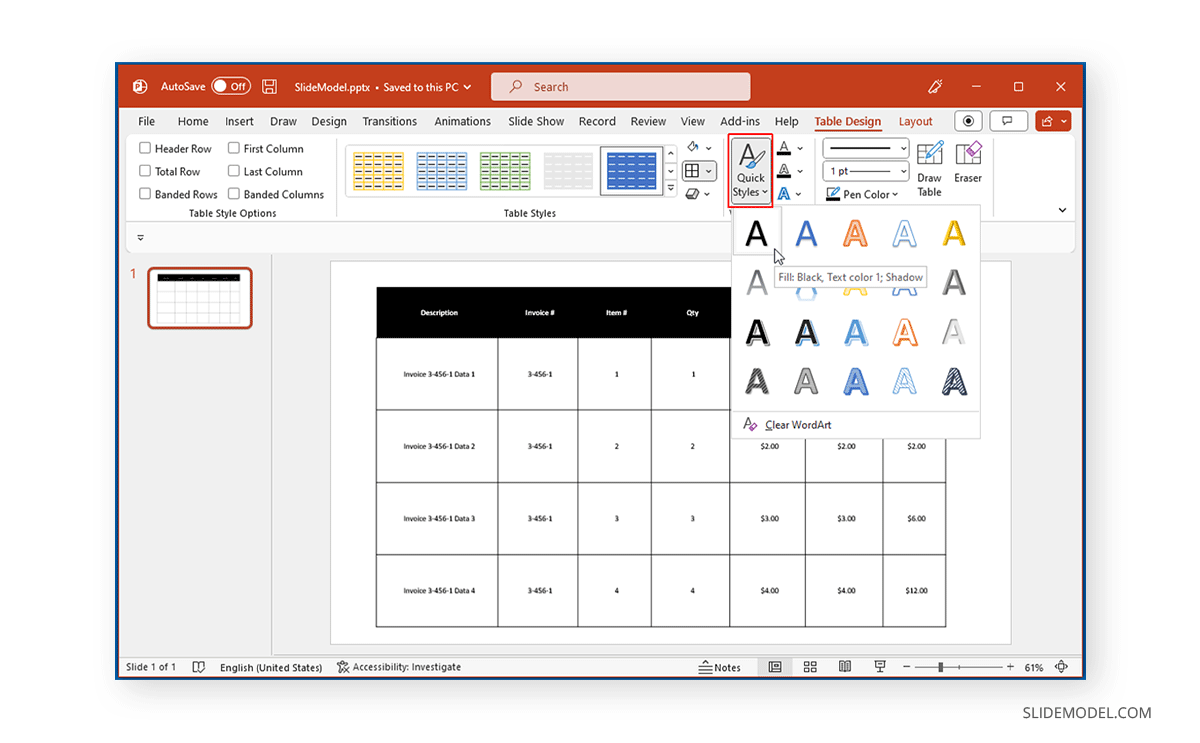
Quick Styles gives font styles and color options to make changes to your table. Similarly, you can draw and erase tables from the Draw Borders menu in the Table Design tab.
PowerPoint Templates with Table Designs
You can also use readymade PowerPoint templates with professionally designed tables to save time and effort. Below is a list of suggested PowerPoint templates that can be used to create different types of tables. These templates provide different table examples in PowerPoint to help create tables with various visually appealing layouts.
1. Phase Gate Process Template Slide Table
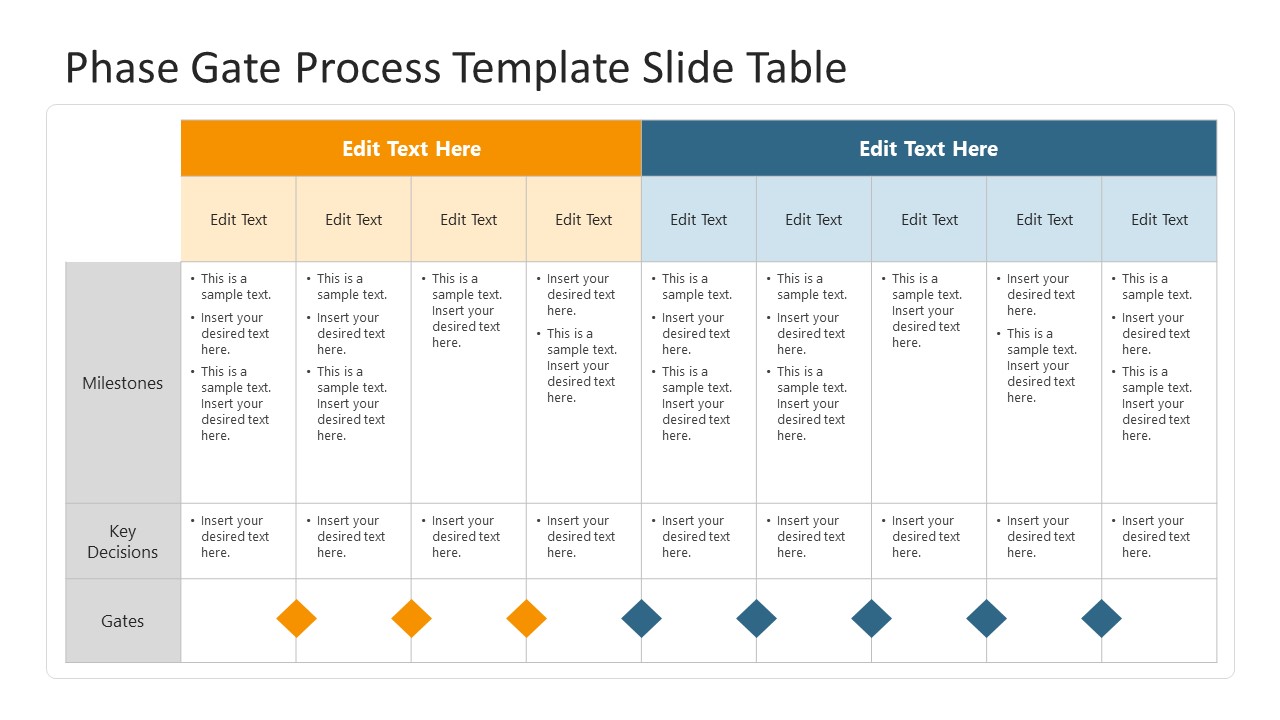
Work with this tabular layout to define a Phase Gate Process with ease. Containing nine stages and eight gates, this table helps in the division of tasks into stages split by decision points. Ideal for any process-development approach.
2. Product Comparison PowerPoint Template
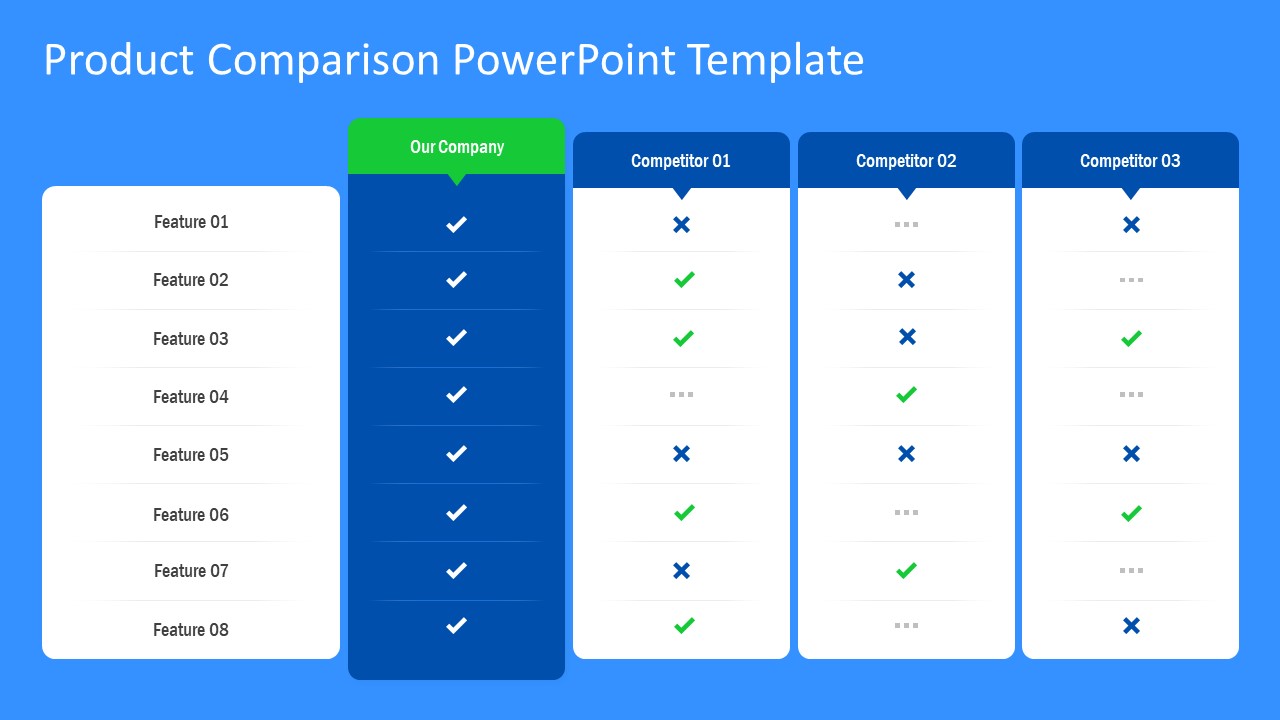
Create powerful product comparison tables by using this PowerPoint table. Practical to use, and editable to add as many rows as required, you can compare one product with 3 different alternatives of your making or competitors in the industry. Work your way with any of these 4 slides listed in this table presentation template.
3. 5×5 Feature Matrix PowerPoint Template
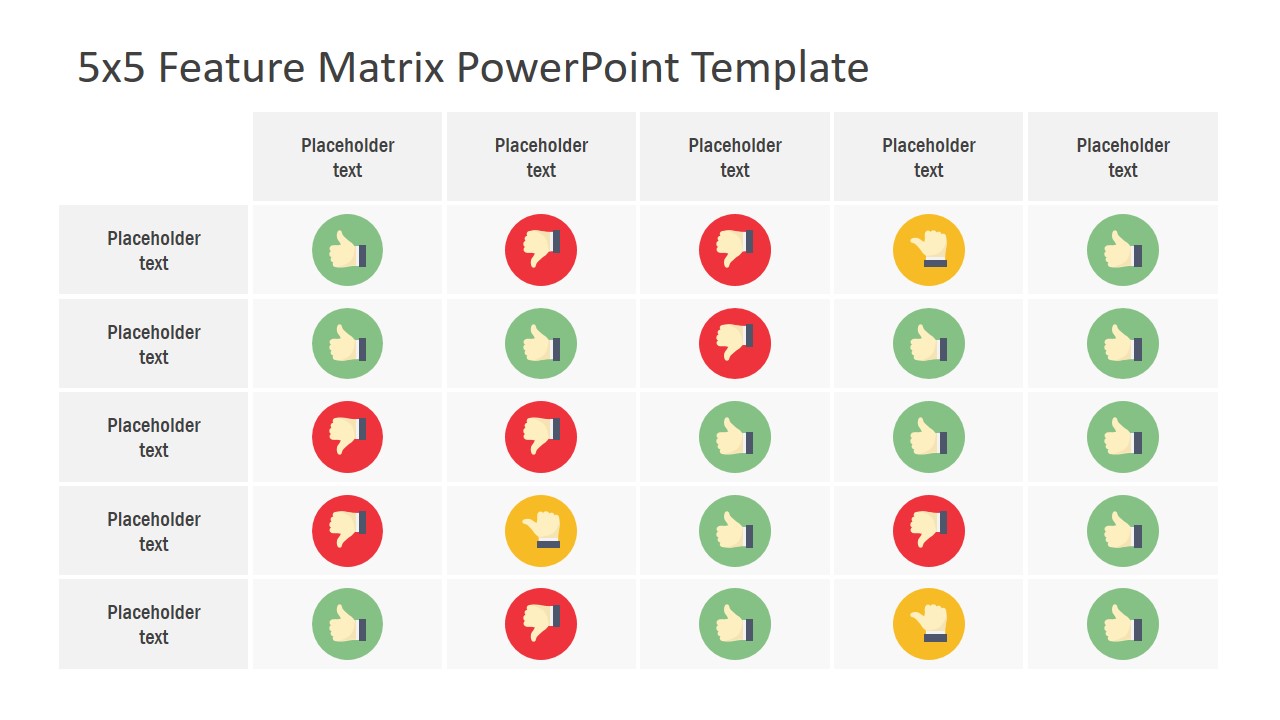
Decision-making processes can be simplified with the implementation of a 5×5 matrix diagram template. This versatile template can be used to evaluate risk in business operations, compare elements in a clear, graphical way, and plenty of other usages in the corporate environment.
You can work with this PPT layout in two different color schemes. Fully editable with PowerPoint and Google Slides.
4. Flat Tabular Matrix PowerPoint Template
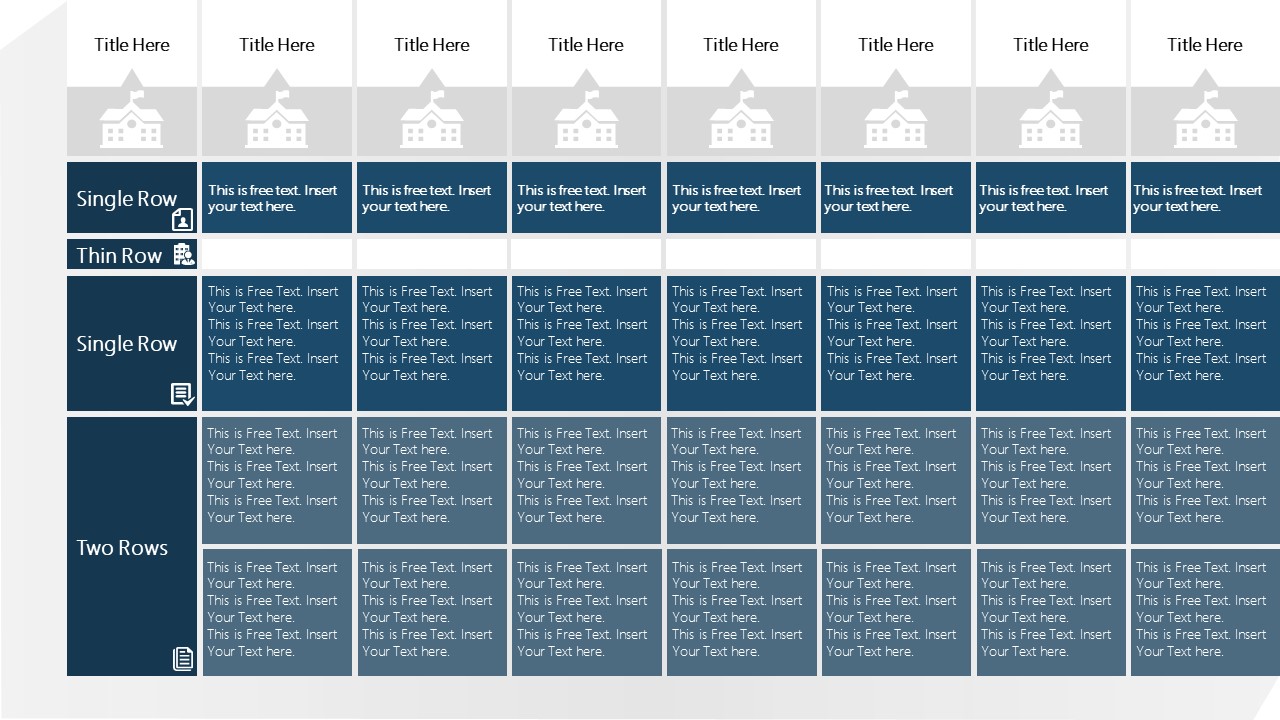
If you look to present different types of data whilst retaining a professional look, then this Flat Tabular Matrix template for PowerPoint is the answer. This PPT template contains three different arrangements of rows and columns, allowing us to tweak the design options to meet the requirements of our projects.
5. Tables with Symbols for PowerPoint
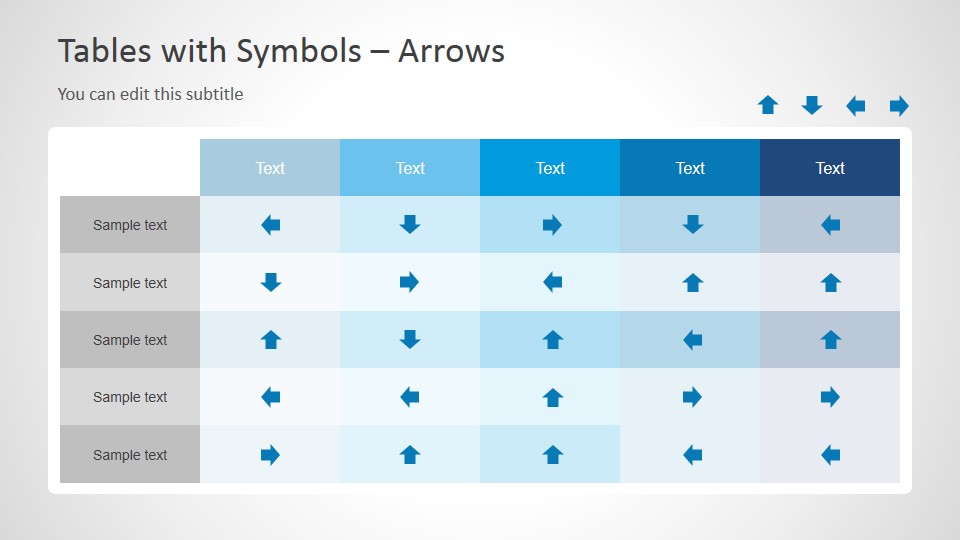
Our final suggestion on this list is a comparison table listing symbols in various formats (arrows, ticks & crosses, and Harvey Balls). You can use this table model to provide information about ongoing projects, sales trends, sales behavior, product comparisons, and way more.
FAQs
Can I draw a custom table in PowerPoint?
Yes, you can draw a custom table by going to Insert -> Table -> Draw Table. Once the table is drawn, you can edit it further using options in the Layout tab.
How can I create a table using data from Excel in PowerPoint?
To create a table from an Excel spreadsheet, go to Insert -> Table -> Excel Spreadsheet, which opens an embedded Excel sheet where you can enter data for the table directly within PowerPoint.
How can I copy and paste a table from another Office app into PowerPoint?
You can easily copy a table from other Office apps like Word or Excel and paste it into PowerPoint using the regular copy-paste functions (CTRL+C and CTRL+V).
How do I enter data into a table in PowerPoint?
Simply click on any cell within the table and begin typing. You can add, edit, or format the text as needed.
How can I add or remove rows and columns in a PowerPoint table?
Go to the Layout tab, where you will find options to add or remove rows and columns under Rows & Columns.
How do I split or merge cells in a PowerPoint table?
You can split or merge cells by selecting the cells, then going to the Layout tab and clicking Split Cells or Merge Cells.
How can I adjust the size of a table or its cells in PowerPoint?
You can adjust the size of the table or individual cells using the Cell Size option in the Layout tab. You can also lock the aspect ratio to prevent unwanted size changes.
Final Words
Creating and designing tables in PowerPoint isn’t very difficult, even for newbies. With some practice, the art of designing tables can be mastered quickly. For making complex tables, some users might also opt to use PowerPoint Shapes and SmartArt Graphics. However, you can make your job easy by using professionally designed, readymade PowerPoint or Google Slides templates to use tables that are intricately crafted for professional use.