
Scientists believe that out of the estimated 15 million species on the planet, only 2 million are known to science. With new species being discovered every year around the world, it is important to classify and find the means to identify organisms easily. For this purpose, the dichotomous key is used to classify animals and plants. However, the use of the dichotomous key also goes beyond the classification of organisms. Let’s take a look at the dichotomous key in detail with a few dichotomous key examples.
Table of Contents
- What is a Dichotomous Key?
- Which are the Types of Dichotomous Keys?
- What are Dichotomous Keys used for?
- Dichotomous Keys Examples
- How to Create a Dichotomous Key
- How to Apply Dichotomous Keys for Business Presentations
- Final Words
What is a Dichotomous Key?
We can define a Dichotomous Key as a systematic and hierarchical organization tool that helps us identify/classify elements on a series of binary choices. A series of questions can be used to classify elements, animals, plants, objects, and more. Since the word dichotomous means divided into two parts, the key contains only two questions for each step until the organism in question is properly classified. Hence, the name dichotomous key.
The dichotomous key comes essentially in the form of a chart, and its application in biological taxonomy helps to classify organisms based on their characteristics. By going through two questions at each step, the chart guides the reader to place an organism in a box, eventually leading to the precise identification of the organism.
Which are the Types of Dichotomous Keys?
Dichotomous Keys can be categorized by their application and structure. Let’s lay out those types below.
Biological Taxonomy Keys
The most common application of dichotomous keys helps biologists identify organisms based on observable characteristics or their morphology.
Botanical Keys
You can find these botanical dichotomous keys through academic life, which helps classify plants. The organization criteria focus on categories such as leaf shape, flower structure, color, preferred soil, and season in which it blooms/harvests, among other relevant characteristics between plant species.
Zoological Keys
Museums often display this usage of dichotomous keys. The zoological dichotomous keys help us to identify and classify animal species by sorting body shape, size, patterns, and other relevant anatomical features. This particular chart is also displayed when we talk about endangered species, so we get a clear picture of which fellow animals could also be exposed to hazards if the threat is related to environmental causes or human factors.
Geological Keys
These dichotomous keys classify rocks, minerals, and other relevant geological formations based on material properties like color, texture, hardness, chemical composition, or even period.
Marketing Keys
Business professionals use dichotomous keys in decision-making processes. A common application is through what’s known as Marketing Keys, which helps to classify consumers’ preferences and organize market segments through binary choices related to consuming behavior, demographics, and more.
Digital Keys
In the final category, we define dichotomous keys; it’s worth discussing the application of this tool in digital technology. Digital keys are relevant when users make choices and receive instant feedback based on their input. Although these kinds of keys could be mimicked in quizzes, the entire application process of these tools often requires specialized software for accurate results.
What are Dichotomous Keys used for?
While the key is usually used for identifying organisms, it is sometimes also for tasks and fault-finding. Below is an overview of the different uses of the key to help answer the fundamental question; what is the purpose of a dichotomous key?
1. Categorizing Organisms
Scientists use dichotomous keys to characterize biological organisms based on their characteristics. For example, a dichotomous key might identify birds based on their feet, toes, and tufts to place them into specific categories in the form of a key. In this case, you will need to identify the bird’s various characteristics in question to find its classification.
2. Categorizing Objects
Other than organisms, the dichotomous key created using a classification chart in two parts at each step is also used for classifying natural objects such as rocks and fossils.
3. Organizing Information for Easy Classification
While you can tell a duck from an owl and a penguin from a crow, can you name their scientific names? For the latter, you might find it difficult to understand where to begin or how to classify the birds. Using a dichotomous key, you can easily identify birds by looking at a simple chart. The chart will provide you with two questions each to identify the bird. For example, the first question might ask you about the bird’s feet type, the second about the number of toes, and the third regarding whether the bird has a tuft. The answer to each question will point you closer to classifying the bird until you find its scientific name. This is an example of how the dichotomous key makes identifying organisms easier or classifying objects.
4. Understanding Scientific Concepts
The dichotomous key is used as a learning tool to make it easier for students to understand difficult scientific concepts. For example, a dichotomous key identifying different characteristics of leaves can enable students to understand better and classify the difference between different types of leaves.
5. Analyzing Consumer Behavior
Moving past biology and geological topics, marketers can understand consumer choices by implementing dichotomous keys. Through a series of binary choices, marketers can comprehend what drove consumers to choose between vendors based on parameters that measure pricing, characteristics, UI/UX performance, and more.
6. Other Uses of the Dichotomous Key
The dichotomous key is also used for tasks or the purpose of fault-finding. Furthermore, since the key is used for finding an unknown thing, it can also be used as an identification key in computer programming or for making something like a dichotomous UI design process chart.
Dichotomous Key Examples
In this section, we will explore two case scenarios for dichotomous keys: geological and marketing keys.
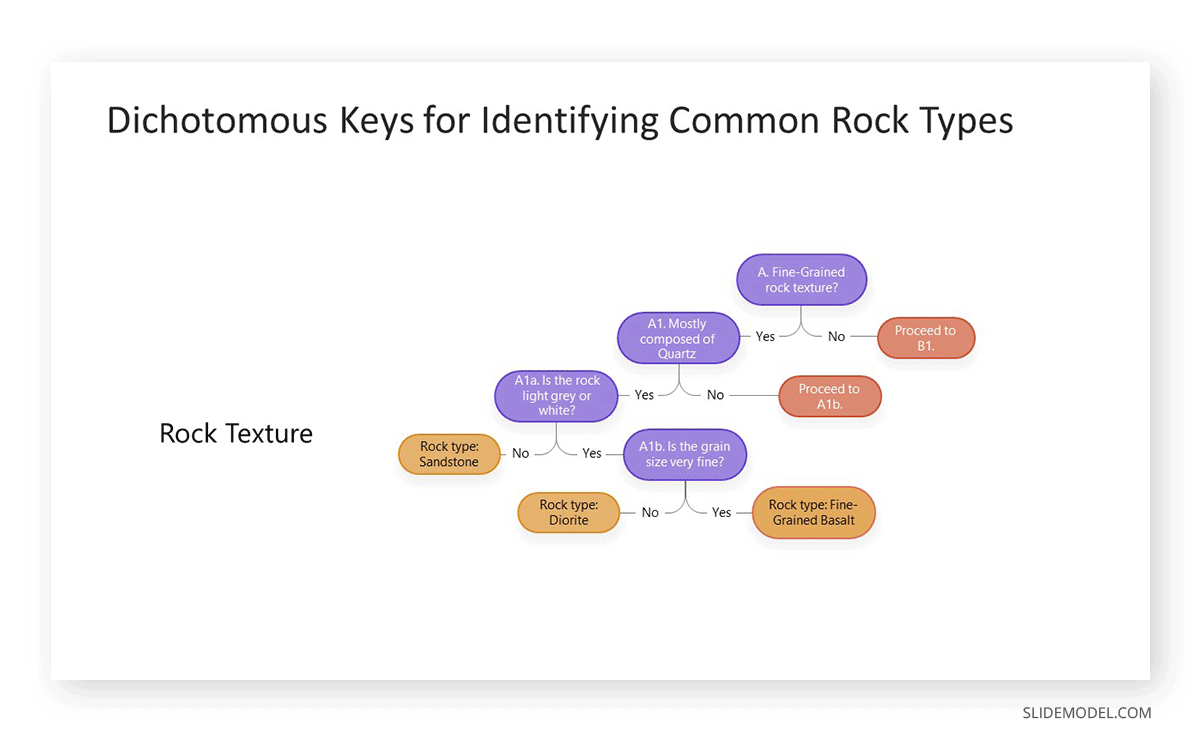
Geological Keys
In this case, the user will sort out rock types based on the rock texture. We start with question A.
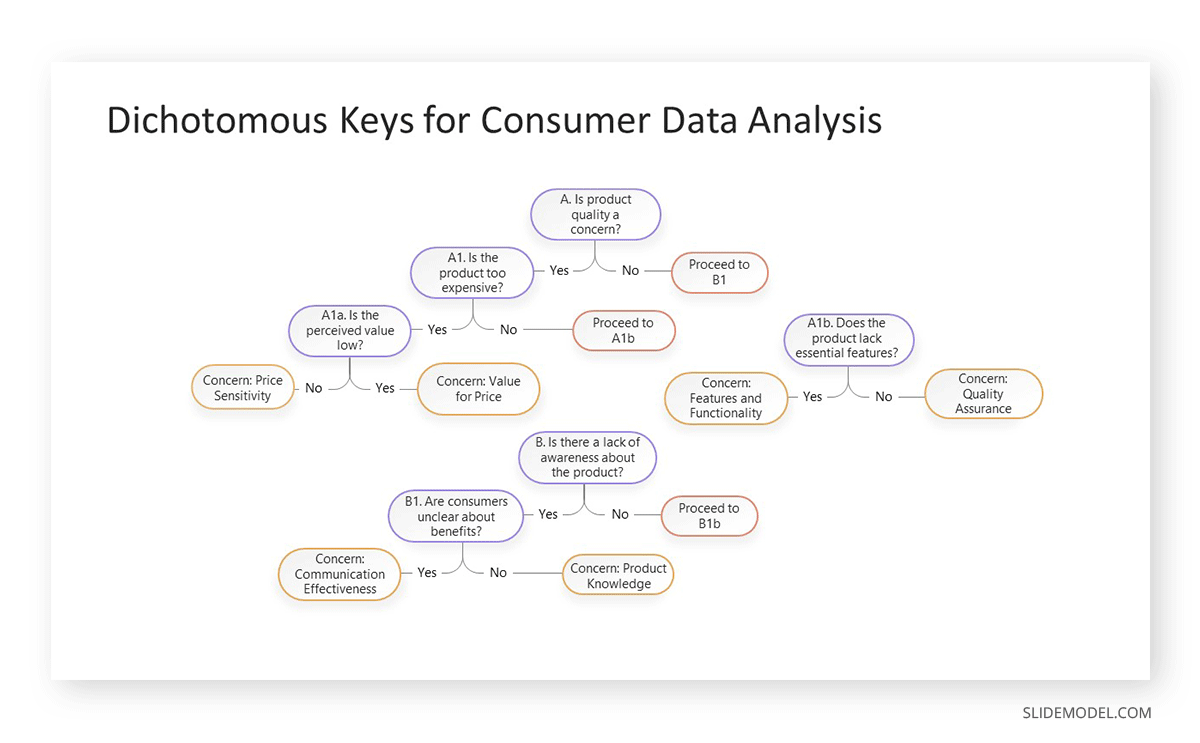
Marketing Keys
For this scenario, a marketing team uses dichotomous keys to analyze survey data.
How to Create a Dichotomous Key
When making a dichotomous key, you must ensure its accuracy and list characteristics in a manner that makes the key reliable. Below are a few steps you can follow to make a dichotomous key.
Classify and List Characteristics
Dichotomous keys are created by examining the elements to be classified based on their key characteristics. To start, you must divide the group based on a single characteristic and then divide each half further into another half. You will continue dividing until each group contains only one item. For example, you can classify the characteristics of animals based on the number of legs, the type of nose, ears, etc.
Organize Characteristics
Once you have listed down and identified the characteristics of your group, you can start organizing the characteristics in the form of a chart.
Divide Specimens Further
When organizing your chart, you will continue dividing the specimens based on the most general characteristics. For example, what type of feet does the bird have? How many toes does the bird have? What type of beak does the bird have?
Draw a Diagram
Once you have classified and divided specimens, you can continue to draw a diagram showing the different classifications based on two questions in each section.
Determine the Pair of Questions and Test the Key
Once your dichotomous key is ready, you can determine the pair of questions that best match the key and test it to see if you can accurately identify the organism or object based on the key.
How to Apply Dichotomous Keys for Business Presentations
Presenters can get benefits from this tool in their presentation-making methodology. This section will give you some insights on upgrading your presentations through a simple brainstorming process using dichotomous keys.
Step 1. Define the Objective
Start by defining the objective of your presentation. Which would be the key takeaways the audience shall get from your talk?
If the presentation is regarding a product launch, then it will offer different insights than a strategic plan or market analysis, and way contrasts with inspirational presentations. Tailor the contents to be disclosed in your presentation according to your audience’s knowledge level.
Step 2. Identify the Decision Points
Asking yourself the critical questions that guide the structure of your talk is among the best presentation skills you can put into practice. These critical questions or decision points should represent the main ideas that contribute to the objective of the presentation.
For example, if we are to deliver a product launch presentation, market segmentation, distribution tactics, and marketing strategy are the decision points, and how you will answer to those questions (with scenarios A or B for each) will tailor the structure of your presentation.
Step 3. Making the Binary Choices
This step is strictly linked to the prior one. The scenarios A or B you create to answer each decision point’s question have to be concise and representative of alternatives to the same problem. Avoid vague answers, as that hinders the logical flow of the dichotomous key.
Step 4. Guiding the Audience
Whenever you present a slide with one of the answers to your decision points, make sure you expose the implications linked to each scenario. In a way, this process mimics the approach a scientist would follow to categorize species, and it gives room for a clear understanding of the topic.
You can use visual aids to represent the structure of your thought process, as you would do on a normal dichotomous key diagram. It ensures that all elements exposed in your presentation are properly established in a logical flow and helps the audience to remember the hierarchical relationship between concepts.
Final Words
Dichotomous keys are not strictly linked to disciplines like biology or geology. Its application can benefit business professionals and academics alike in breaking down complex concepts into a series of addressable binary choices. Learning how to master this tool will result in more articulated presentations that the audience will easily recall for their superb performance.
1. Flat Business Process Flowchart for PowerPoint
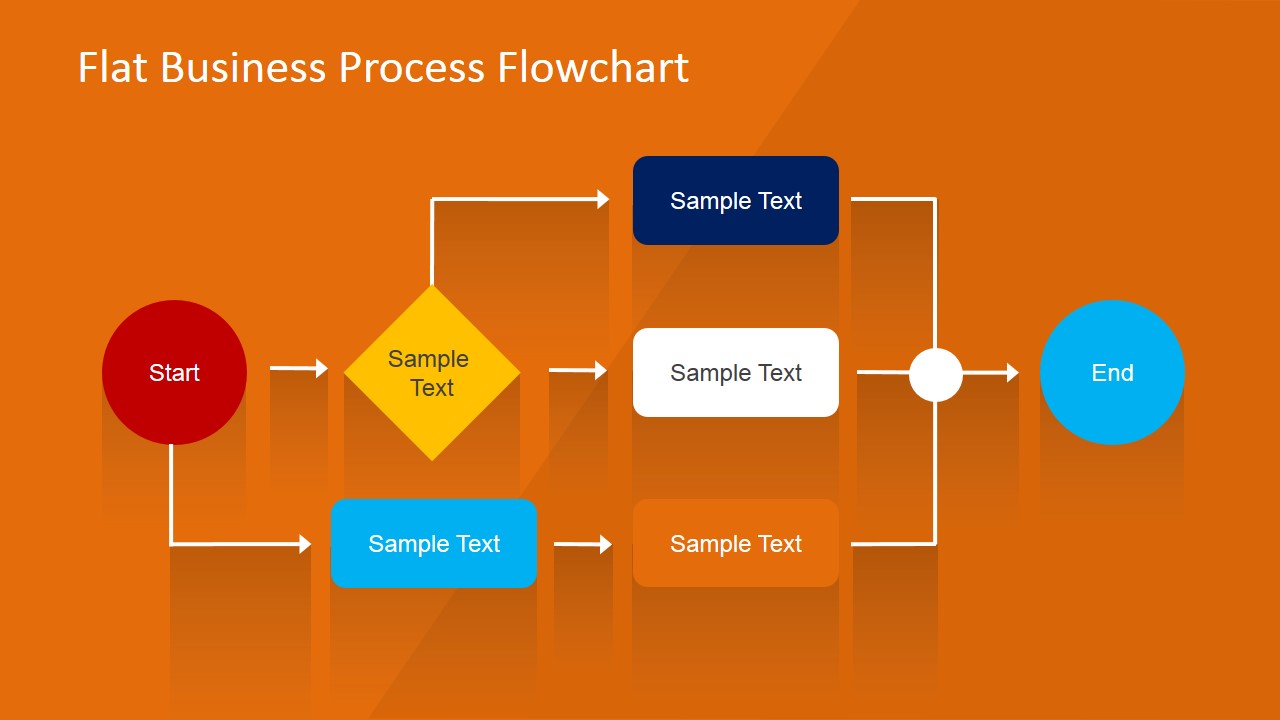
A Flowchart is an ideal resource to represent dichotomous keys since it offers distinctive icons for stages in the process. IT professionals often use these graphics to summarize processes in steps rather than words to express them.
Say an employee has to address a situation with a binary path process in the resolution method. Still, at some point, answers to that problem are relevant to that stage and multiple other solutions. Use our Flowchart template for PowerPoint to simplify the branch tree of answers into easily actionable steps that follow a logical flow.
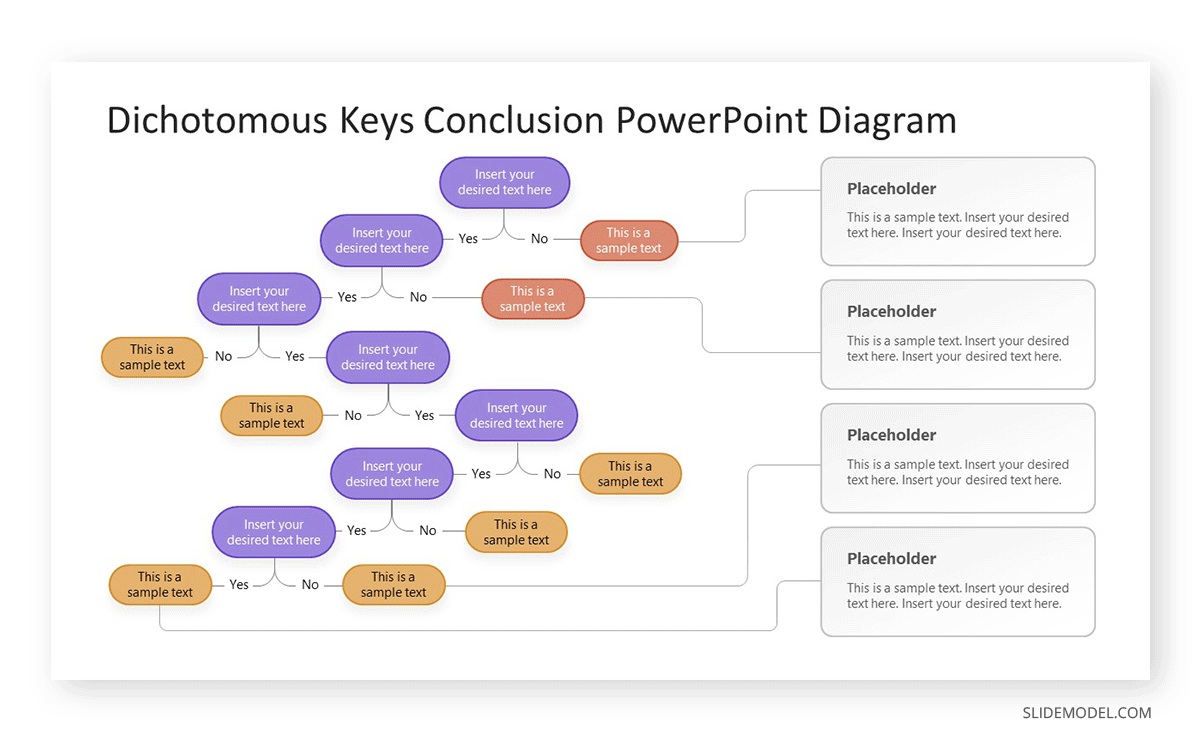
2. Dichotomous Keys Conclusion PowerPoint Diagram
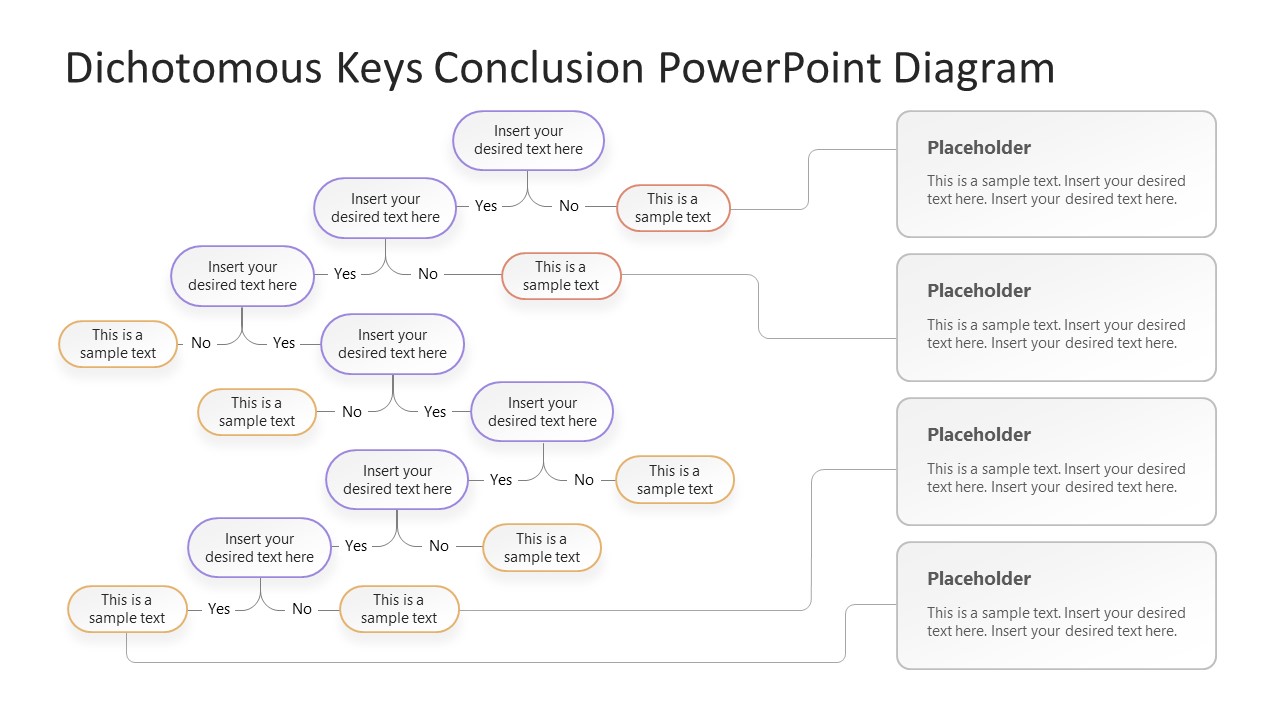
Implement the Dichotomous Keys diagram used in this article by grabbing this 100% editable PowerPoint and Google Slides template. This visual dichotomous key diagram uses a series of colors to highlight the navigation path to the required answer. With larger question shapes and small-sized branched responses, we can easily apply this template in a broad range of subjects like biology, botanicals, chemistry, and several other academic research areas, but also to more mundane procedures like customer ticket resolution.
Check this template today and adapt it to your project’s requirements. In the right area, there are placeholder text boxes that help presenters express particular points or answers in more detail.
3. Simple Flowchart Template for PowerPoint
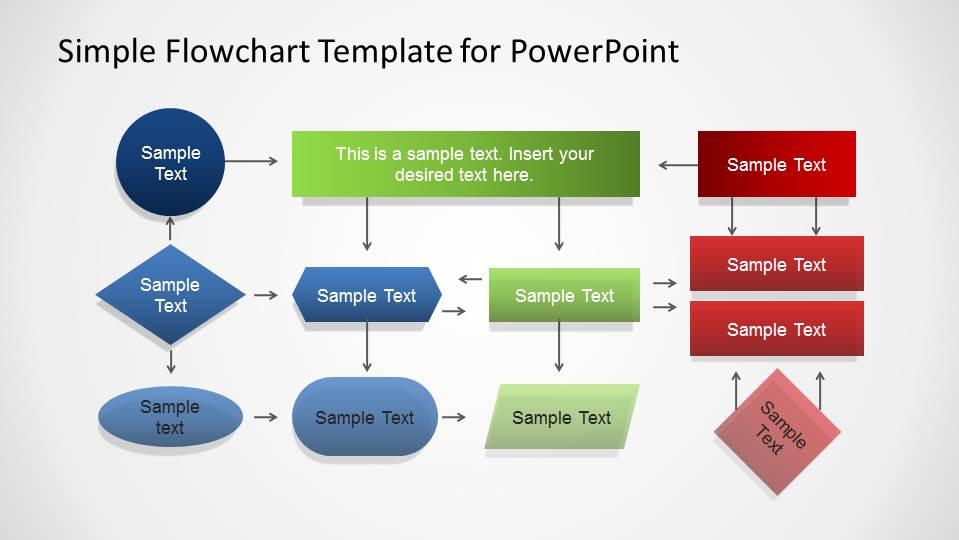
Another flowchart template, this time using a bright gradient color scheme to make the text stand out. Easy to use and edit to your preferences, you can fully customize its fill, stroke, and shadow effects.
4. Metro Style Flow Chart Template for PowerPoint
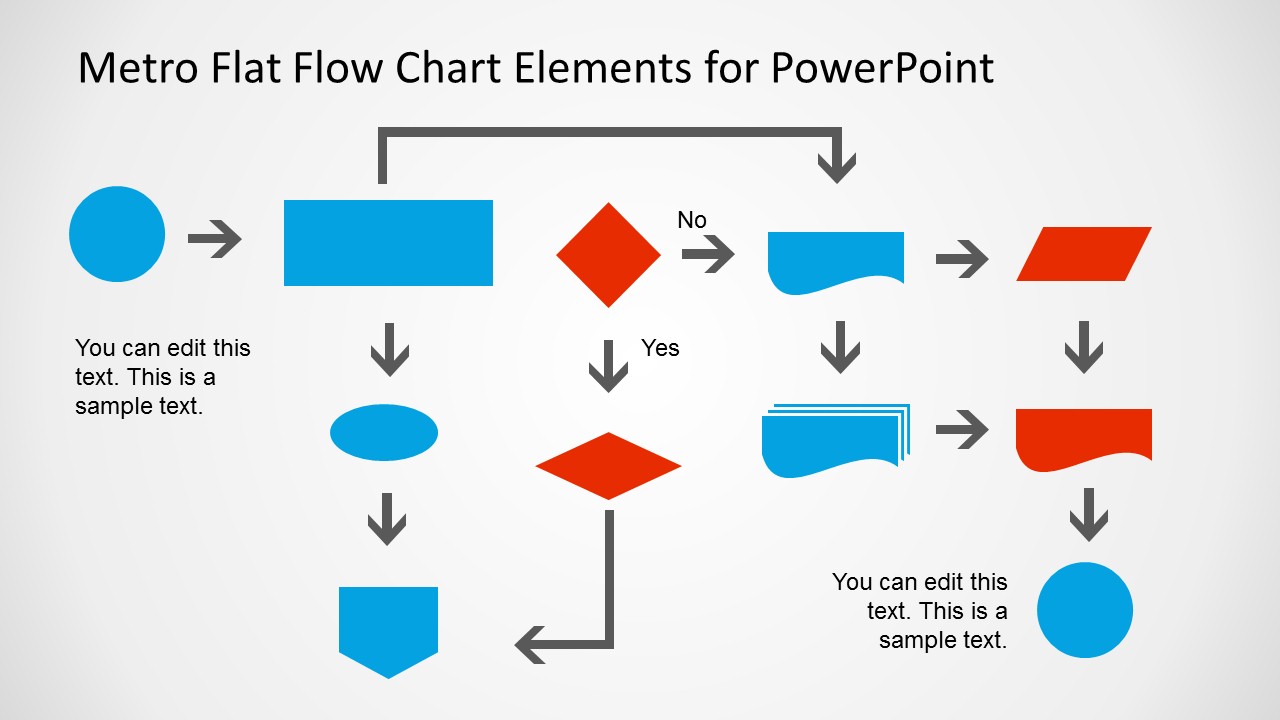
What if you want to use shapes that are outside the conventional oval, rectangle, circle, and prism in these flowchart diagrams? To attend to such needs, we crafted this distinctive Metro Style Flow Chart Template for PowerPoint, a set of 3 slides that are structured in this format:
- First slide: Flow Chart
- Second slide: Arrows and connectors
- Third slide: Shapes for the flow diagram
This way, you can create entirely unique flowcharts for your presentation and surprise the audience. Check it out now.
5. Recognition-primed Decision (RPD) Process Template for PowerPoint
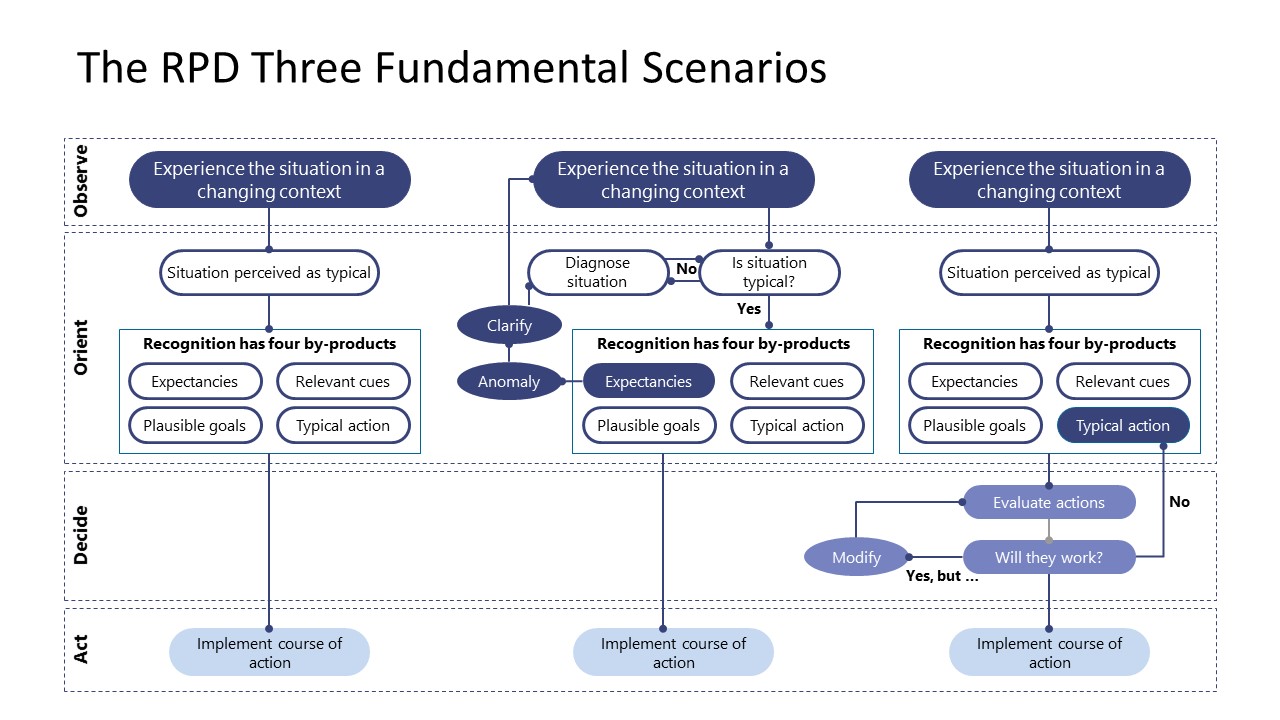
The RPD or Recognition-Primed Decision Process is a flowchart intended for complex decision-making processes. Situational cues are displayed as patterns that accelerate the decision-making stage, and they can be used to trace back a thought process and re-evaluate decisions.
Work with this RPD Process template for any academic presentation or complex business decision. Users can differentiate two scenarios when applying these presentation slides: explaining a decision-making process or creating a decision-making process that records the steps involved in reaching a choice.
6. Hand Drawn Flow Chart Template for PowerPoint
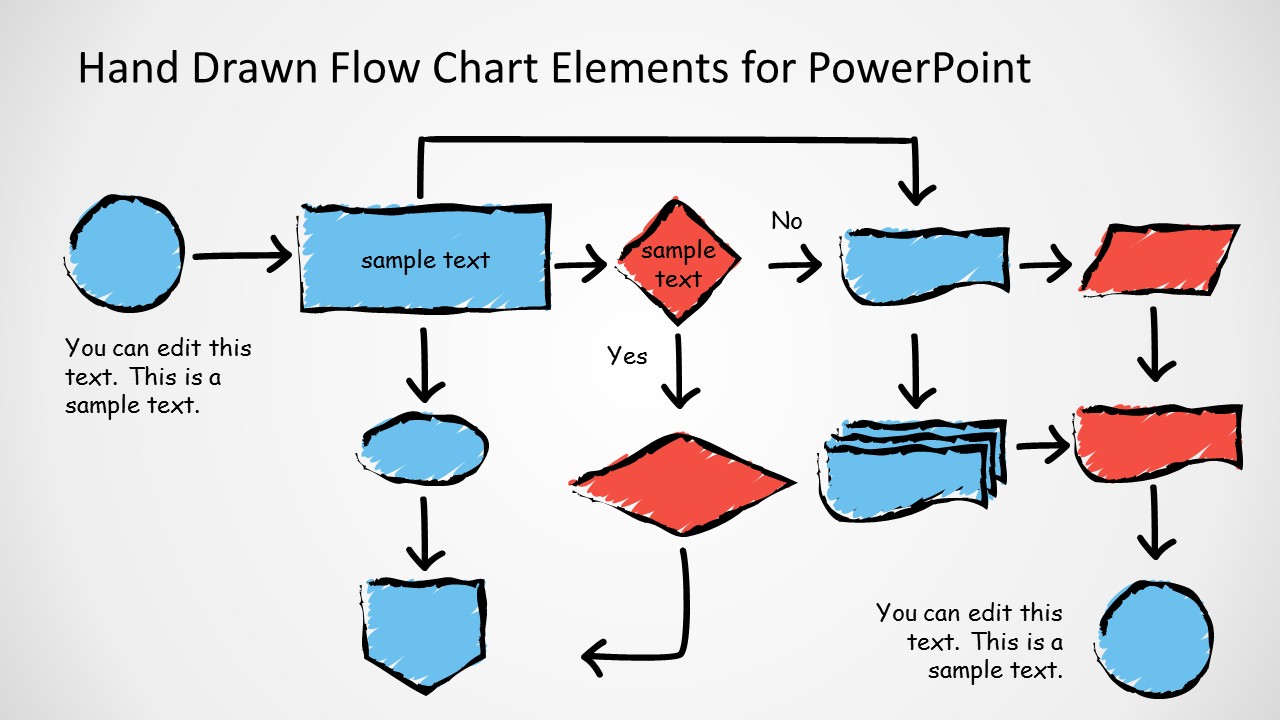
If you want to boost creativity in your presentations, here we deliver a flow chart template with strokes made of hand-drawn lines. Ideal for presentations in which brainstorming and traditional art elements are present, such as product presentations using marker-styled industrial drawings. Fully editable chart with any PowerPoint version.