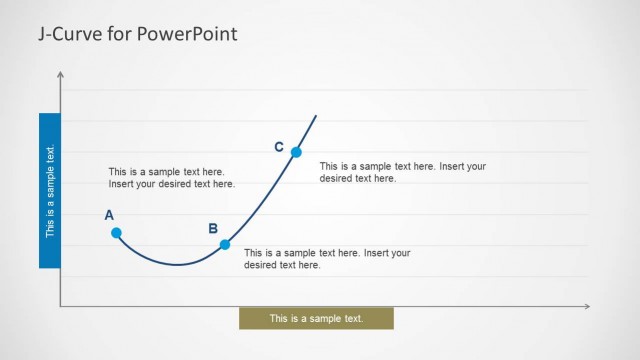
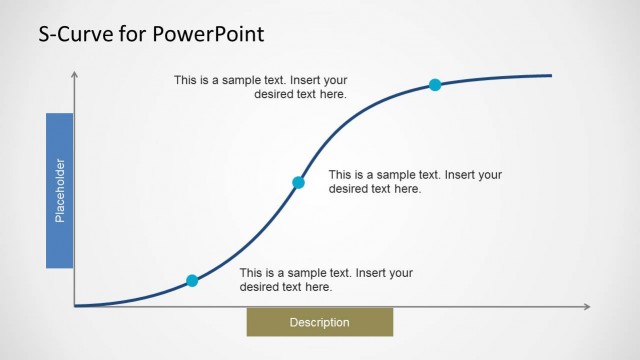
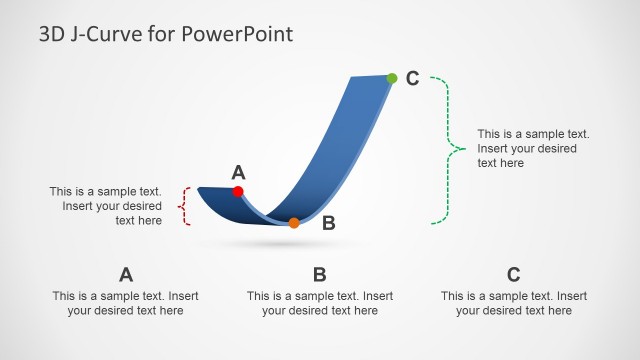
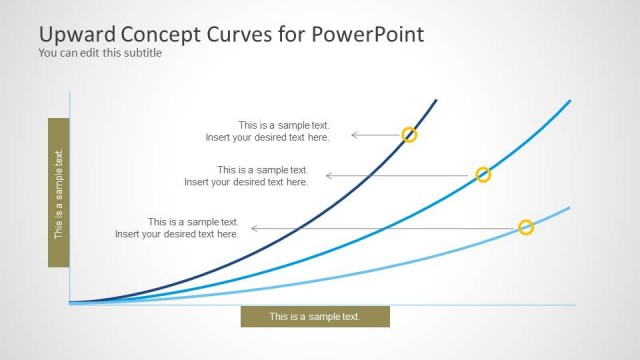
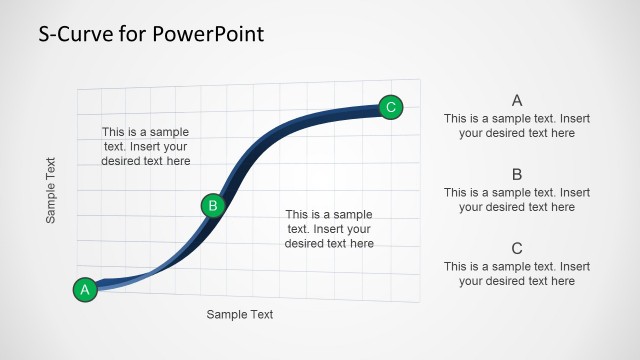
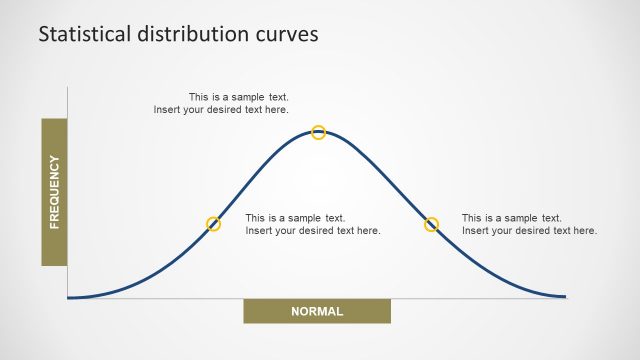
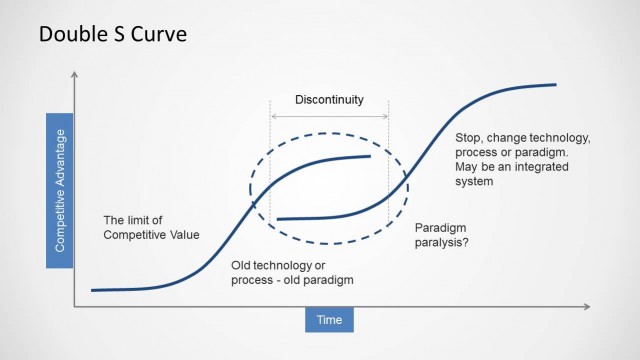
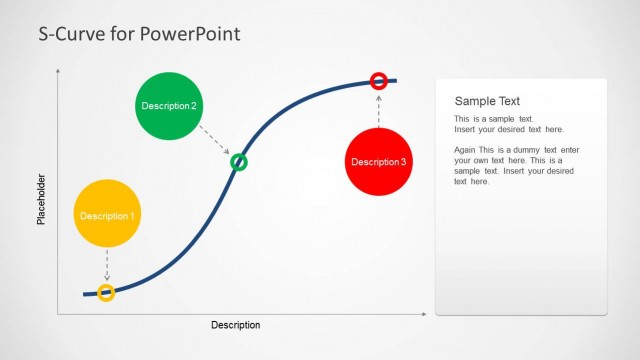
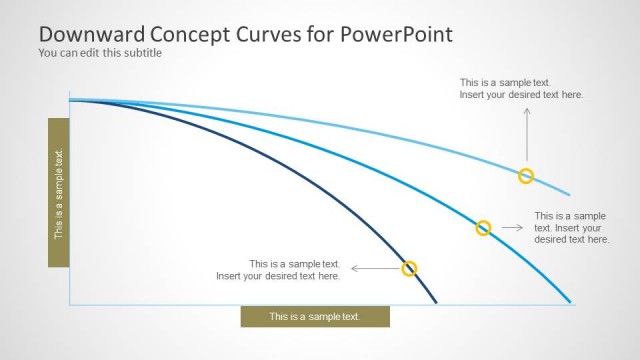
U-Curve for PowerPoint is a simple presentation design with useful slides that you can use to model a U shaped curve in PowerPoint. This curve can be used in business presentations but also for education purposes. This presentation can be helpful if you need an U shaped curve or inverted U shaped curve.
Inside this template you can find a representation of the Kuznets curve with an inverted U shape. The Kuznets curve is the representation of Simon Kuznets’ hypothesis that states that as a country develops, there is a natural cycle of economic inequality driven by market forces which at first increases inequality. Then it decreases after a certain average income is attained.
What’s inside this template
Example presentation scenarios
- An economics instructor can use the Kuznets inverted U-curve to explain how inequality may rise and then fall as income per capita changes.
- A business analyst can use the multi-line U-curve chart to compare cost behavior scenarios with solid and dashed curve variations.
- A strategy consultant can use the single U-curve diagram to show a simple relationship between two variables before adding detailed recommendations in the text panel.
- An operations manager can present cost versus quantity tradeoffs using the labeled axes and editable description callouts on the U-curve chart.
Features
- 100% editable presentation template
- Compatible with Microsoft PowerPoint and Google Slides
- Scalable vector shapes, icons and illustrations
- AI-Ready for Microsoft Copilot and Claude
- Instant access and download
Frequently asked questions
Q: How should I explain the main message with a U-curve diagram?
A: Start by naming the two variables on the axes, then describe what happens on the left side, at the low or high point, and on the right side. Use the callout labels for the turning point and key interpretation, not long explanations. Keep the right-side text panel for assumptions or business implications.
Q: Who is this template best suited for?
A: This template fits analysts, educators, consultants, and managers who need to teach a relationship rather than report a data table. It works well for cost versus quantity, performance versus effort, or inequality versus income because each slide leaves room to explain the meaning of the curve beside the diagram.
Q: Why use a U-curve or inverted U-curve metaphor instead of a standard line chart?
A: The U shape makes the turning point the visual focus, which is useful when the insight is about reversal, optimization, or diminishing returns. The inverted Kuznets curve slide uses the same structure in reverse, making it clear that the relationship rises to a peak before declining.


U-Curve for PowerPoint
3-slide PowerPoint presentation template with U-curve diagrams and a Kuznets curve example
U-Curve for PowerPoint is a 3-slide diagram template for explaining U-shaped and inverted U-shaped relationships. It includes a multi-line U-curve chart, a single U-curve diagram, and a Kuznets curve example with axis labels and callout text areas for business, economics, and education presenters.


 Loading...
 Microsoft PowerPoint
 Microsoft Copilot
 Claude for PowerPoint
Other formats supported
Subscribe today and get immediate
access to download our PowerPoint templates.