Slide 3 of 3 from U-Curve for PowerPoint
Kuznets curve inverted u curve for PowerPoint
Kuznets Curve - Inverted U-Curve Diagram
- Diagram
- Other
- Concept Explanation Slide
- 16:9
- 100% Editable
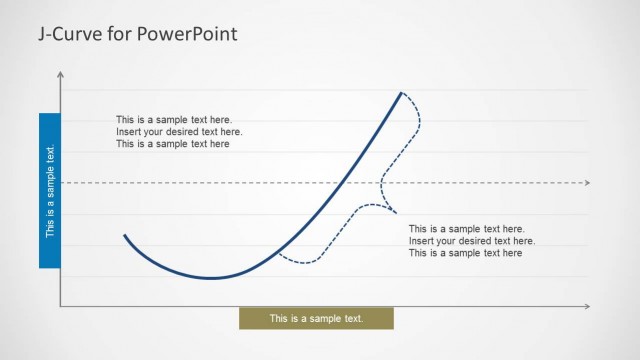
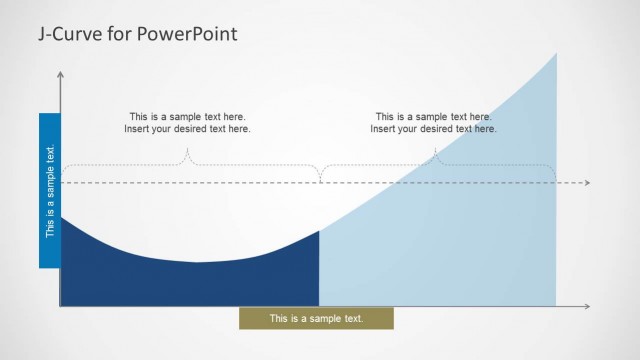
The Kuznets Curve - Inverted U-Curve slide from the U-Curve for PowerPoint template visually explains the economic relationship between income per capita and inequality using an editable diagram. This slide layout is ideal for business presentations and educational lectures requiring clear representation of complex economic concepts through professional slide templates with editable shapes and vector icons.
What’s on This Slide
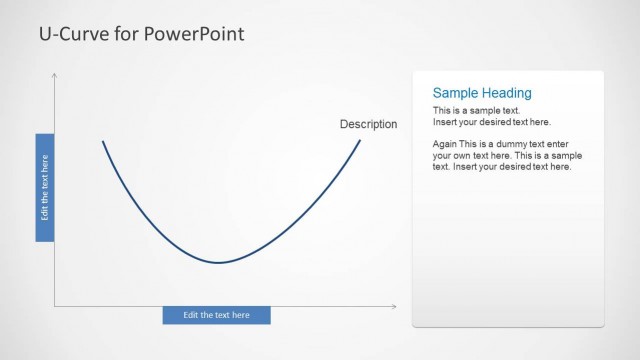
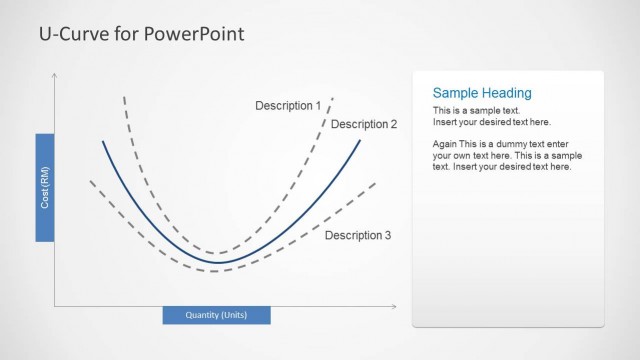
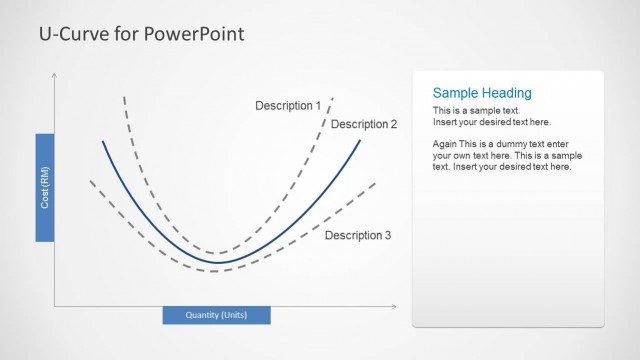
The layout features a central inverted U-curve chart, representing the Kuznets curve. The curve is outlined in a dark blue color, with the x-axis labeled 'Income per Capita' and the y-axis labeled 'Inequality.' To the right, there are two text placeholders for a heading and body text, aligned vertically. The heading is positioned at the top, followed by a description area below it. The background is a light gradient, enhancing the visual clarity of the curve and text. The overall composition is balanced, with a clear visual hierarchy.
How to Use It
This layout serves as a diagram to illustrate the relationship between income per capita and inequality, typical in economic presentations. It fits well in a sequence following an introductory problem slide, leading into discussions about economic theories or policies. This structure is useful for presenting findings in research, educational contexts, or business analyses focused on economic trends. It can effectively communicate complex relationships in a clear and concise manner.
Text Placeholders & Capacity
Keep your copy within these limits so it fits without resizing. Body slots can hold approximately 25-30 words each.
| Placeholder | Count | Max characters (approx.) |
|---|---|---|
| Slide title | 1 | 30 |
| Body paragraph | 2 | 150 |
| Item heading | 2 | 20 |
Slide Keywords
Download unlimited PowerPoint templates, charts and graphics for your presentations with our annual plan.
DOWNLOADReturn to U-Curve for PowerPoint.