Slide 2 of 3 from U-Curve for PowerPoint
6121-03-u-curve-2
Single U-Curve Diagram for Presentations
- Diagram
- Other
- Concept Explanation Slide
- 16:9
- 100% Editable
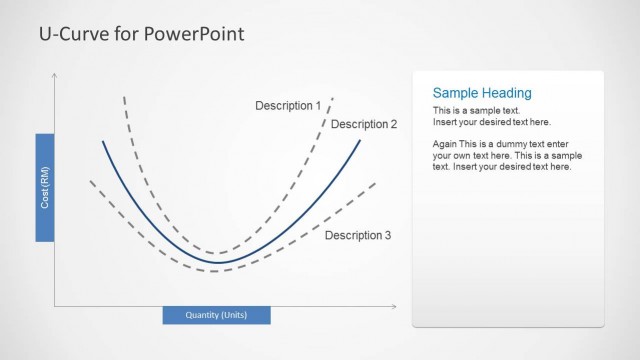
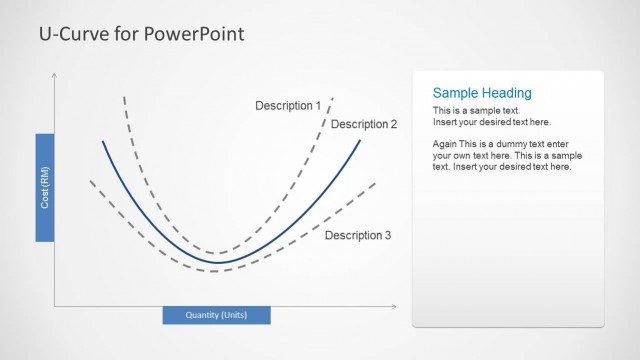
The Single U-Curve Diagram slide from the U-Curve for PowerPoint template offers a clear visual tool for illustrating U-shaped relationships and performance trends. This slide layout is designed for business presentations and pitch decks that require precise explanation of economic or educational concepts. Featuring editable shapes and text placeholders, it supports effective communication of complex data within professional slide decks.
What’s on This Slide
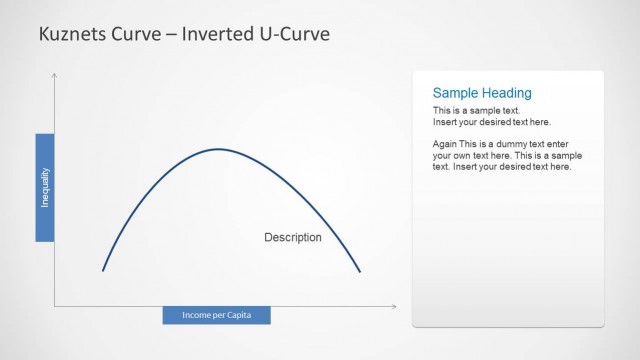
The slide features a U-curve diagram positioned centrally, with a smooth curve extending from the left to the right. On the left side, there is a vertical text placeholder labeled 'Edit the text here.' Below this, another horizontal placeholder is present, also labeled 'Edit the text here.' To the right, there is a rectangular text box containing a sample heading and descriptive text. The overall background is light, enhancing the visibility of the blue curve. The visual hierarchy emphasizes the curve and accompanying text areas.
How to Use It
This layout serves as a visual representation of U-shaped relationships, ideal for illustrating concepts in business, economics, or education. It fits well after a problem slide, providing a clear transition to a solution or analysis. This slide can be used to explain trends, performance metrics, or other relationships that follow a U-curve pattern, making it suitable for presentations that require visual data interpretation.
Text Placeholders & Capacity
Keep your copy within these limits so it fits without resizing. Body slots can hold about 10-15 words each.
| Placeholder | Count | Max characters (approx.) |
|---|---|---|
| Slide title | 1 | 30 |
| Item body | 2 | 50 |
| Item heading | 1 | 30 |
Slide Keywords
Download unlimited PowerPoint templates, charts and graphics for your presentations with our annual plan.
DOWNLOADReturn to U-Curve for PowerPoint.