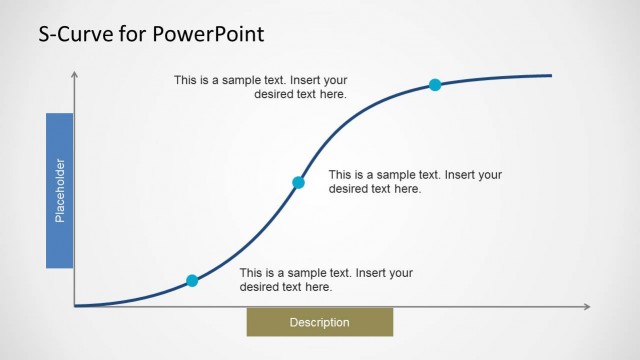
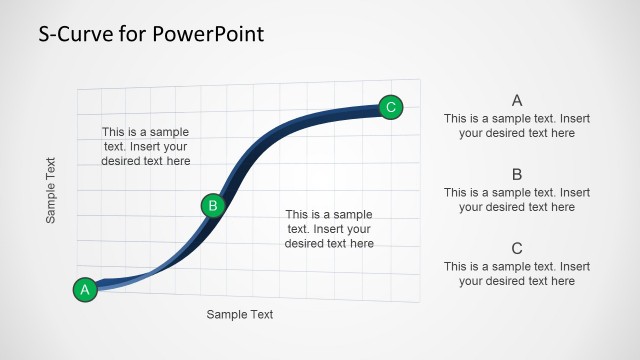
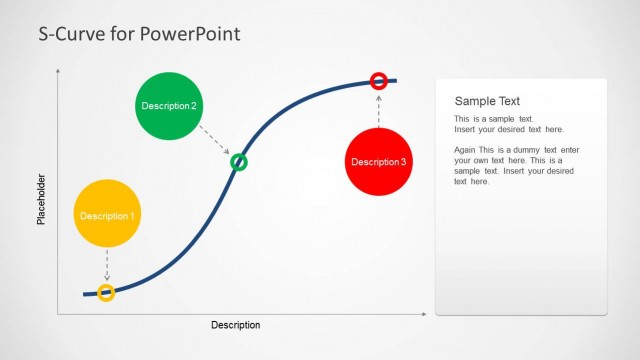
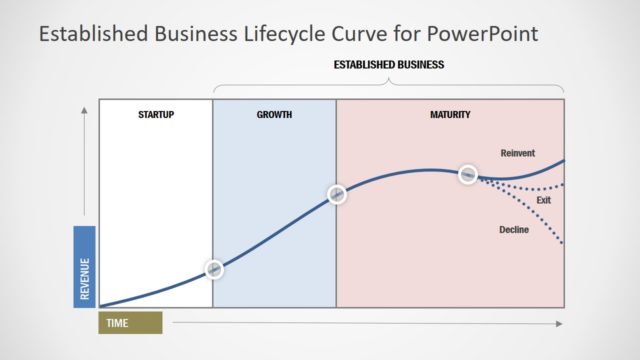
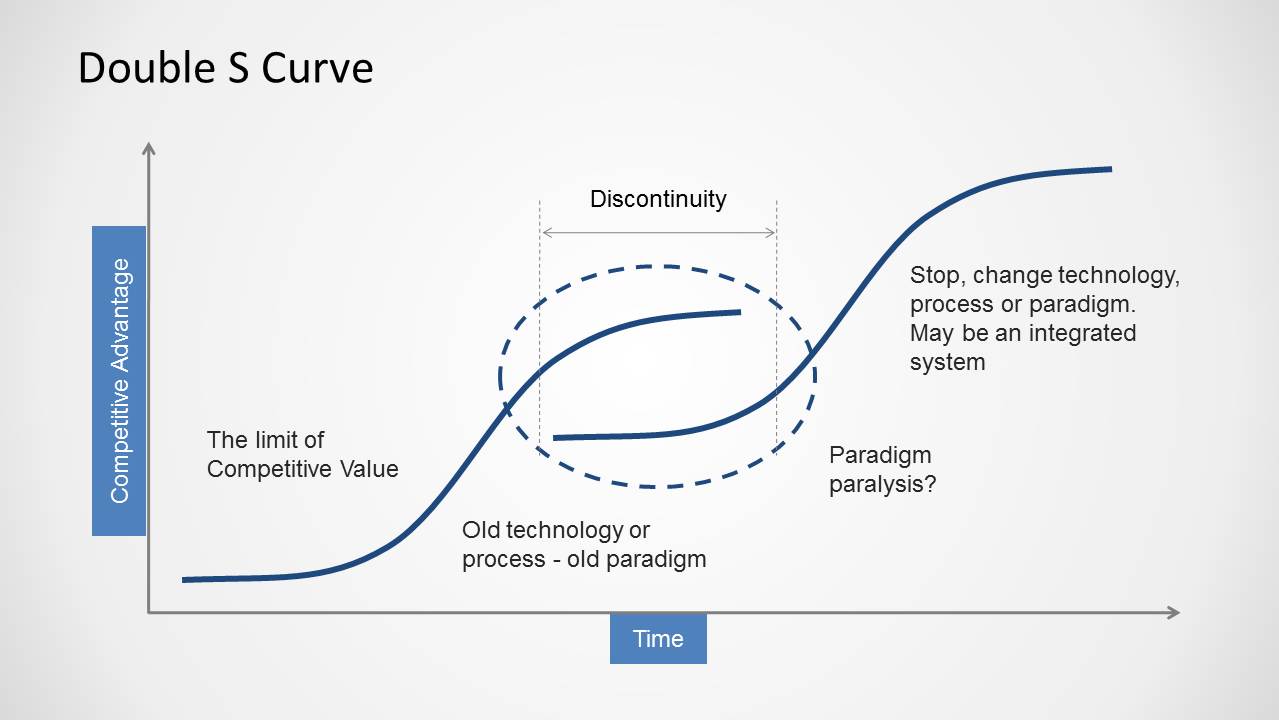
Doble S Curve Template for PowerPoint is a presentation template containing the Double S curve model and available as a PowerPoint presentation file. In the S-curve every product goes through three different environments on the way to market acceptance. At the beginning the growth is slow but then there is a rush by the mass market. Finally in the S shaped curve, there is a peak of acceptance where replacements become the norm. S-Curve is also used as a forecasting tool and for strategy management as a strategic innovation tool for established companies.
This double S curve model for PowerPoint was created drawing a Bezier curve and you can easily edit the points in Microsoft PowerPoint to adjust the slope. Alternatively you can download other S-Curve PowerPoint designs as well as other popular curves for PowerPoint presentations.
What’s inside this template
Example presentation scenarios
- A strategy consultant can use the discontinuity diagram to explain why an incumbent technology reaches a competitive value limit before a replacement curve becomes credible.
- An innovation manager can use the start-up, scale, compete, and transition markers to brief leadership on where a new capability sits in its growth path.
- A product manager can use the annotated innovation progress curve to discuss adoption assumptions, timing risks, and next-step decisions with cross-functional stakeholders.
- A business development presenter can use the double S curve comparison to frame a market entry discussion around disruption, transition timing, and competitive advantage.
Features
- 100% editable presentation template
- Compatible with Microsoft PowerPoint and Google Slides
- Scalable vector shapes, icons and illustrations
- AI-Ready for Microsoft Copilot and Claude
- Instant access and download
Frequently asked questions
Q: How should a presenter explain the double S curve without making the model feel abstract?
A: Start with Slide 1 and name the current technology, the emerging alternative, and the discontinuity zone. Then use Slide 2 to place the initiative on a clear stage such as start-up, scale, compete, or transition. Finish with Slide 3 by replacing the placeholder callouts with decisions, risks, or adoption signals.
Q: Who is this template best suited for in a strategy presentation?
A: This template fits presenters who need to explain technology change rather than list project tasks. Strategy consultants, innovation leads, and product executives can use it when the key message is that one curve is maturing while another is gaining momentum, creating a timing decision for investment or migration.
Q: Why does the S curve metaphor work well for innovation and disruption topics?
A: The S curve turns adoption into a visible shape: slow early progress, faster growth, and a maturity plateau. Showing two S curves together makes replacement logic easier to discuss because the audience can see the old path flattening while the next curve forms. The dashed discontinuity zone focuses attention on the strategic inflection point.


Doble S Curve Template for PowerPoint
3-slide PowerPoint presentation template with double S curve diagrams for innovation and competitive value analysis
Doble S Curve Template for PowerPoint is a 3-slide presentation template for explaining innovation adoption, competitive value limits, and technology transition. It includes a double S curve discontinuity diagram, a staged growth curve with start-up, scale, compete, and transition markers, and an annotated innovation progress curve.

 Loading...
 Microsoft PowerPoint
 Microsoft Copilot
 Claude for PowerPoint
Other formats supported
Subscribe today and get immediate
access to download our PowerPoint templates.