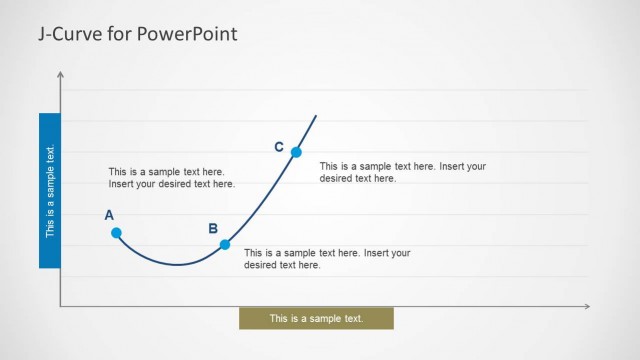
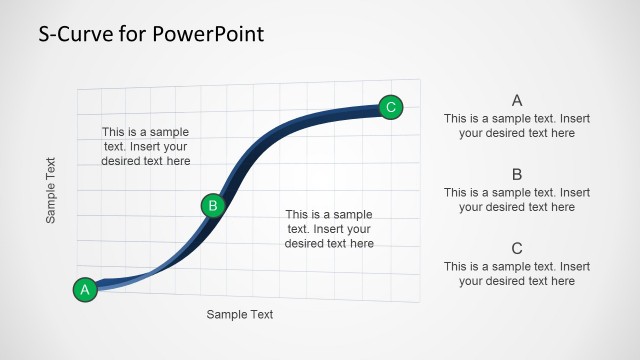
The J-Curve is an important concept for elaborating upon different J shaped diagrams. The 3D J-Curve Template for PowerPoint can help you construct an accurate J Curve for displaying important technical information in your presentation.
Using the editable 3D diagrams in this template you can construct anything from economic ‘J curve’ diagrams to show a country’s balance of trade, elaborate upon historical tendency of private equity funds in a presentation or even make a J curve for presentations related to Medicine or Political Science.
This template can accommodate all types of J-Curve diagrams and help you create them by editing readymade sample layouts.
What’s inside this template
Example presentation scenarios
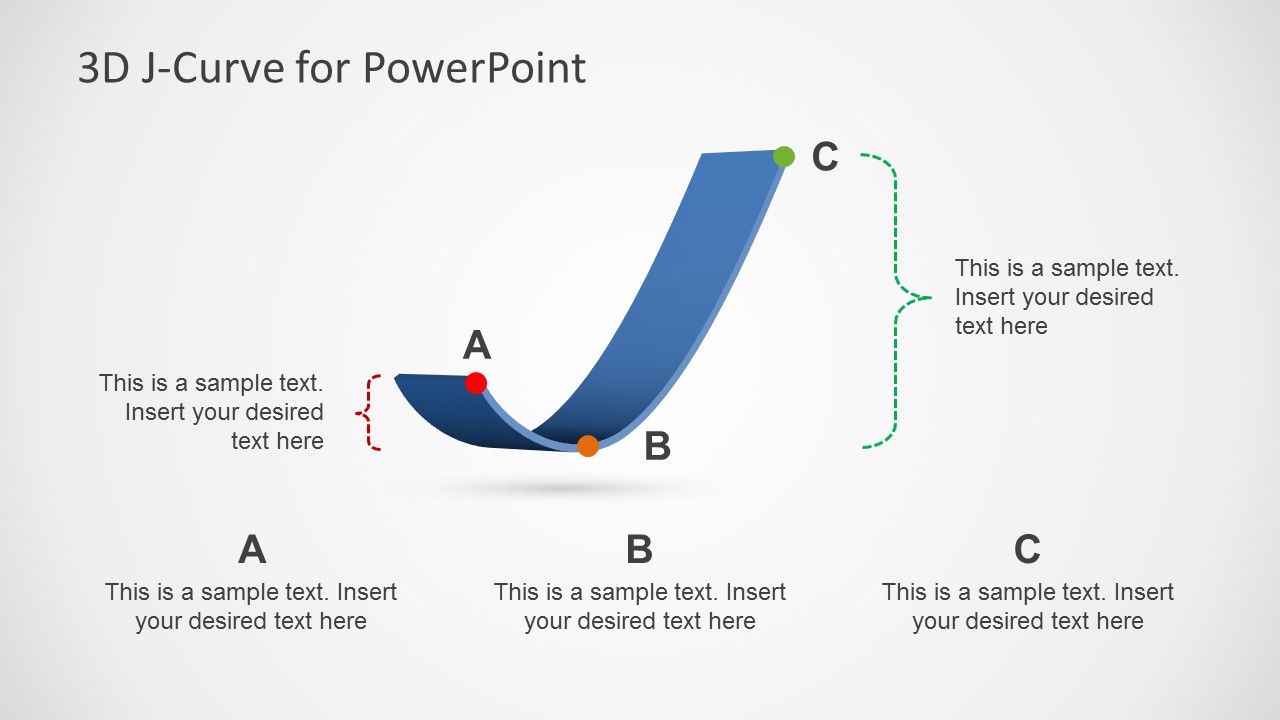
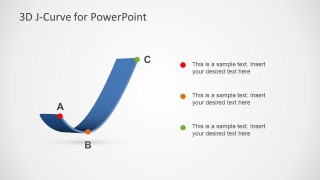
- An economist can use the labeled A-B-C curve to explain how a trade balance or policy effect may worsen before it improves.
- A private equity presenter can use the curve markers and legend layout to describe early losses, the low point, and later value creation.
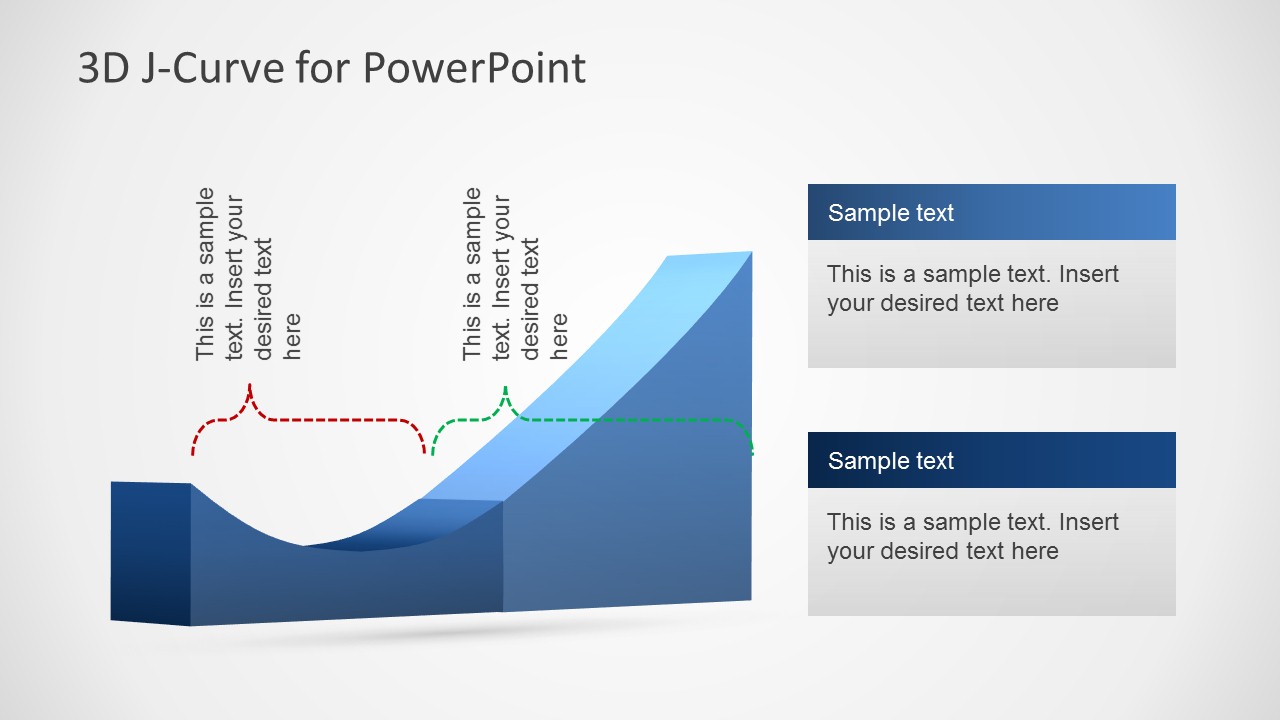
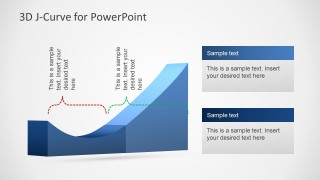
- A consultant can use the 3D area curve with callout panels to summarize a client transformation pattern from disruption to recovery.
- An educator can use the dashed brace annotations to teach students how to interpret staged trend movement on a J-shaped diagram.
Features
- 100% editable presentation template
- Compatible with Microsoft PowerPoint and Google Slides
- Scalable vector shapes, icons and illustrations
- AI-Ready for Microsoft Copilot and Claude
- Instant access and download
Frequently asked questions
Q: How should a presenter explain the J-curve clearly with this template?
A: Start by defining what the vertical movement represents, then walk the audience through the A, B, and C points as a sequence: initial decline, bottom point, and recovery. Use the brace callouts for causes or time periods, and reserve the bottom text blocks for concise interpretation rather than long technical notes.
Q: Who is this J-curve template best suited for?
A: This template works best for presenters explaining a staged reversal pattern, especially analysts, economists, investment professionals, consultants, educators, and policy teams. It is a good fit when the message depends on showing that early negative movement can precede later improvement, not when the audience needs exact data values.
Q: Why does the 3D J-shaped curve help communication?
A: The 3D curve makes the drop, trough, and upswing visually memorable, while the color-coded markers separate the main stages without needing a full chart. The dashed braces create natural explanation zones, so the presenter can discuss causes, consequences, or phases around the curve instead of crowding the diagram.

3D J-Curve Template for PowerPoint
3-slide PowerPoint presentation template with 3D J-curve diagrams, stage markers, and callout panels
This is a 3-slide presentation template for J-curve diagrams with 3D curve stages, labeled point progression, a color-coded legend, and callout panel layouts. It suits economists, analysts, educators, and consultants explaining a dip-and-recovery pattern, investment curve, or technical trend using editable PowerPoint shapes and vector graphics.


 Loading...
 Microsoft PowerPoint
  Microsoft Copilot
  Claude for PowerPoint
 Other formats supported
Subscribe today and get immediate
access to download our PowerPoint templates.