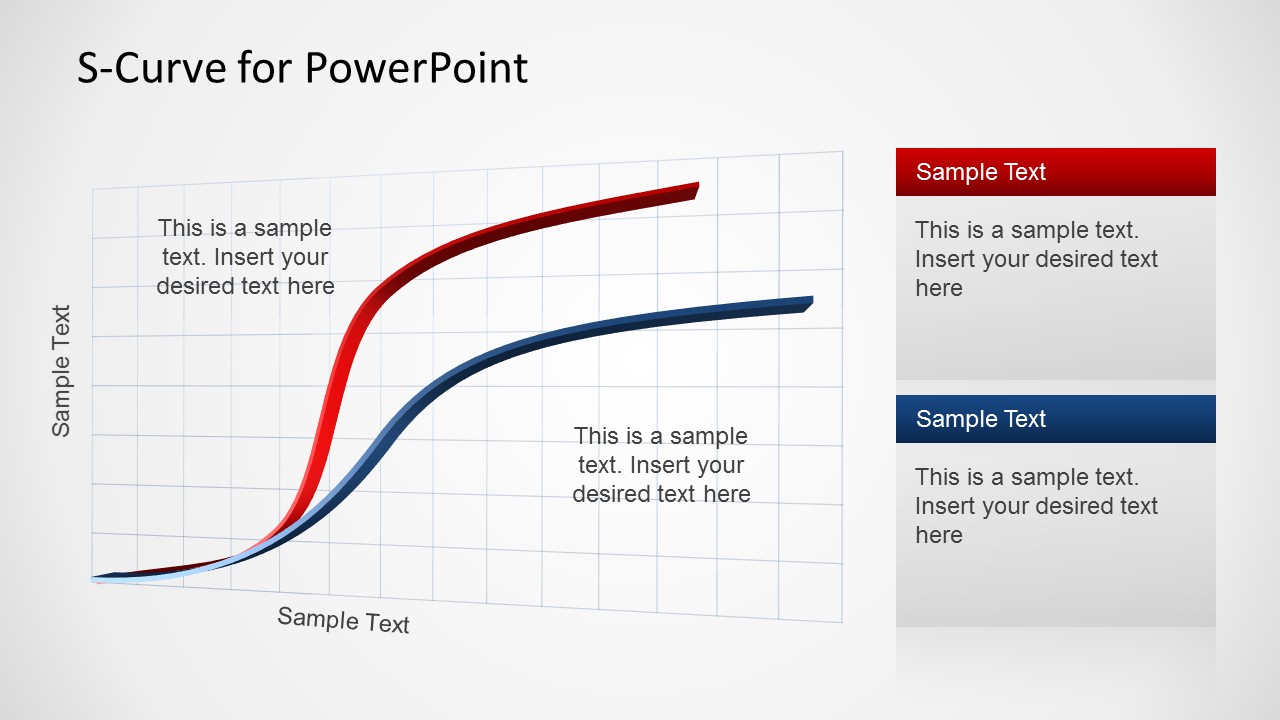
Creative S-Curve Template for PowerPoint
The Creative S-Curve Template for PowerPoint is among our collection of Curve Templates for PowerPoint which provide editable diagrams for constructing curves.
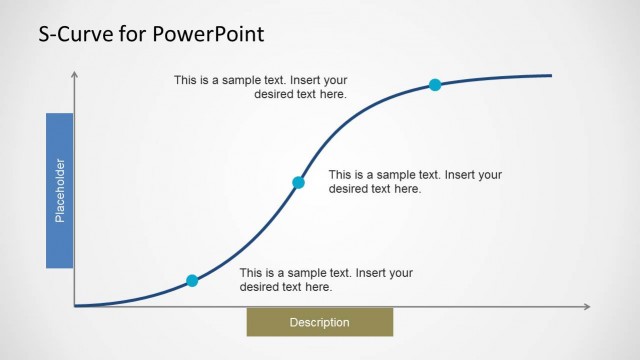
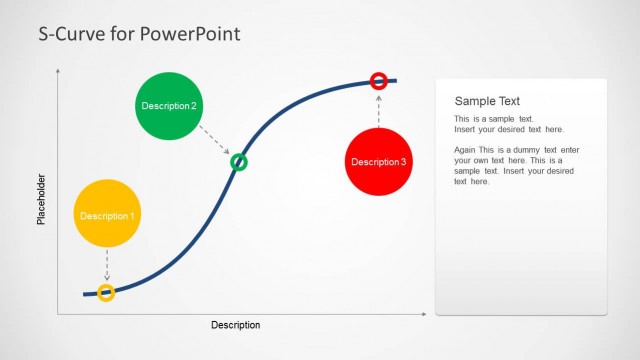
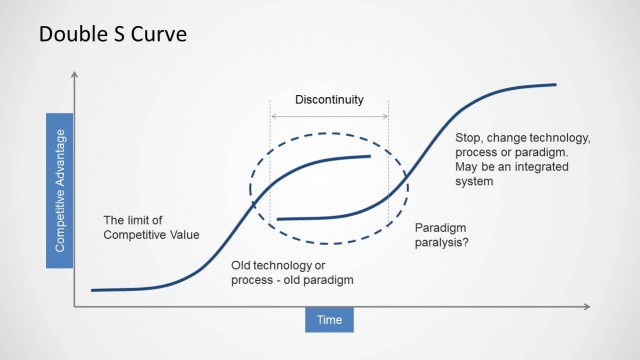
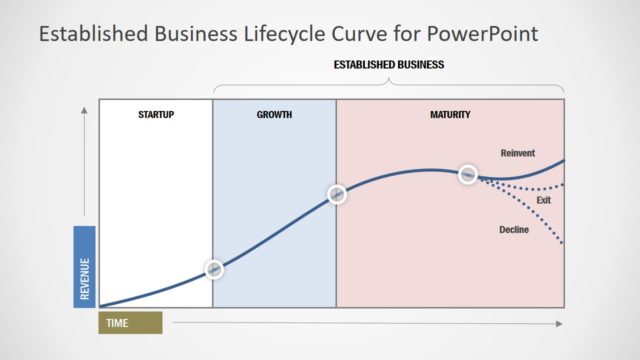
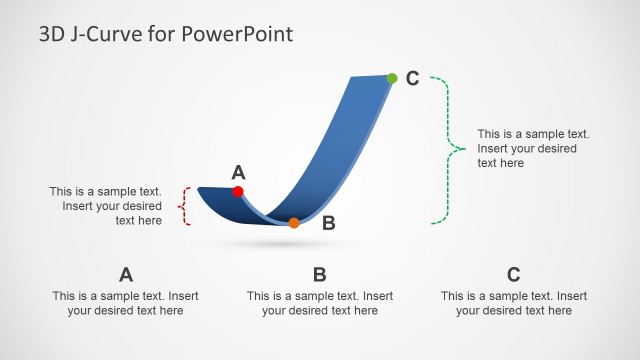
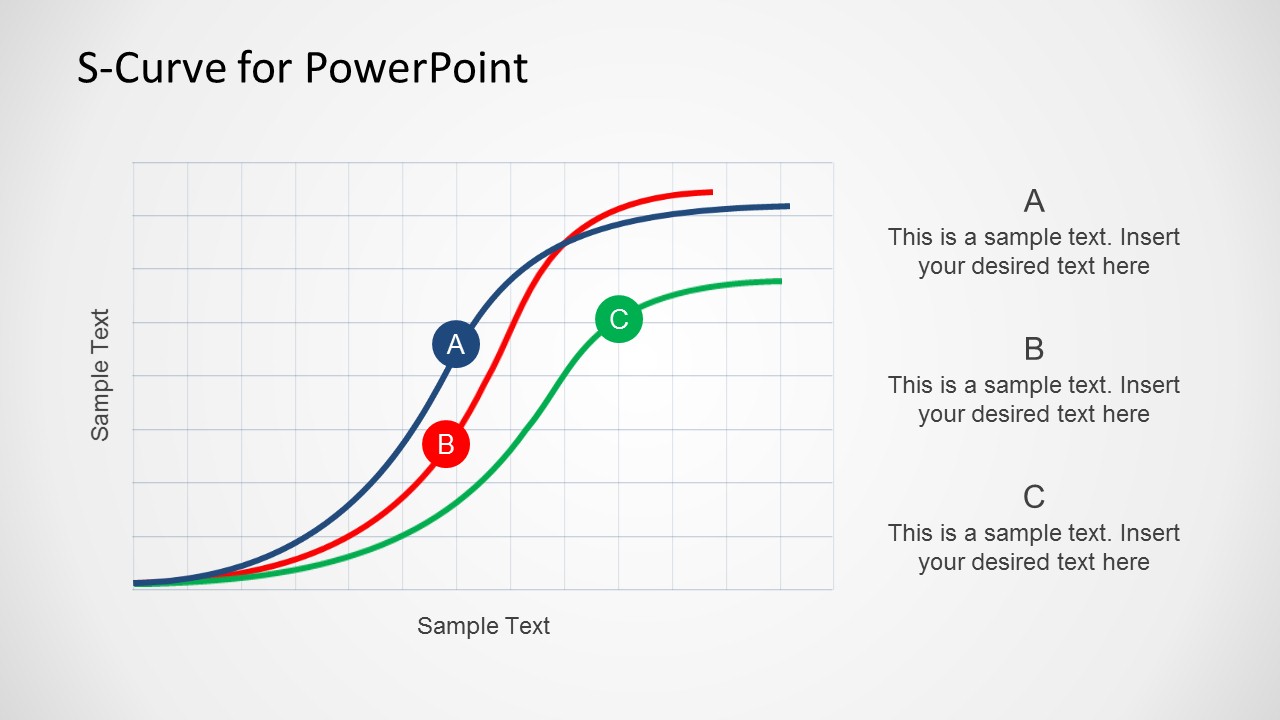
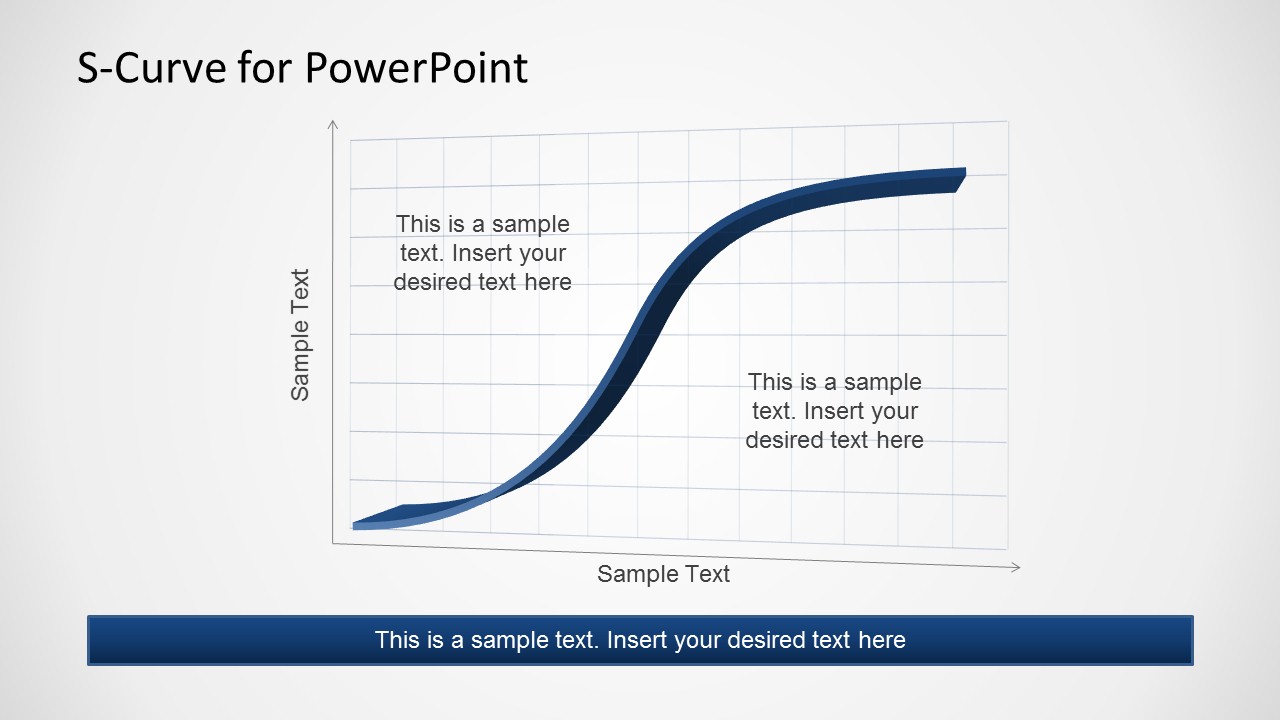
With this highly customizable template you can construct accurate S-Curve diagrams for displaying growth of a variable by performing minor edits to the existing diagrams in the sample slides. The S-Curve is also known as Sigmoid curve and it can help to create a relationship between two different attributes or parameters. This shape is sometimes associated with potential business growth in revenue and it is not only used for complex Math formulas and statistics but also in other presentation topics, including sales, business, project management, world population, currency and more.


You must be logged in to download this file.
DOWNLOAD- Category
- Curves & Lines
- Rating


 Loading...
- Item ID
- 6489-01
- Colors
Subscribe today and get immediate
access to download our PowerPoint templates.