Thermometer PowerPoint Charts
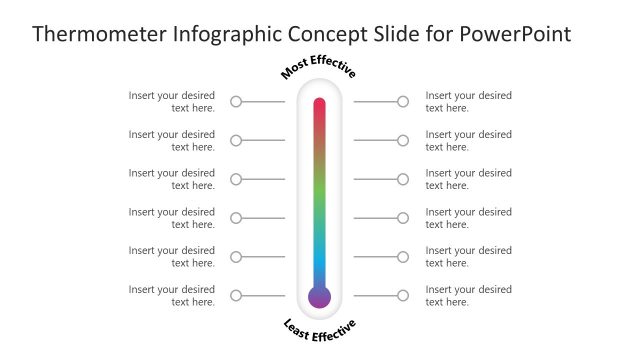
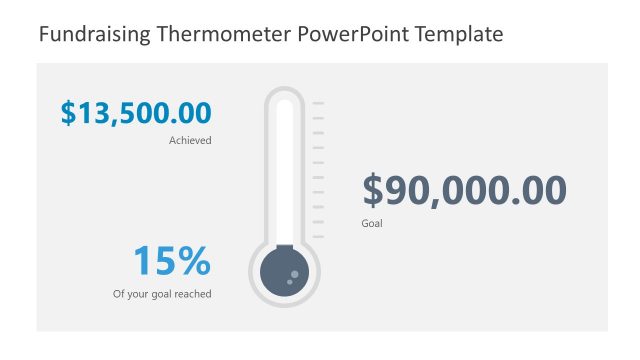
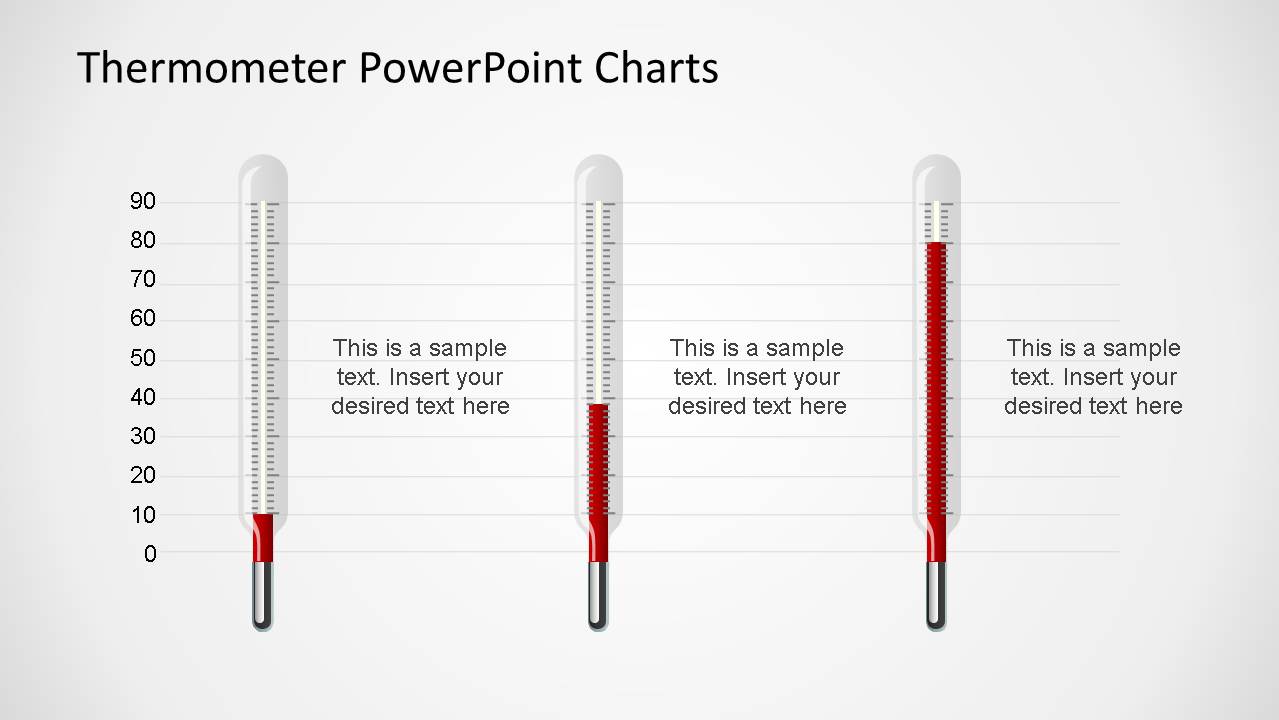
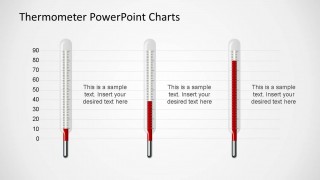
Thermometer PowerPoint Charts is a creative set of PowerPoint Charts created using professional thermometer PowerPoint shapes. Each slide presents a PowerPoint Bar Chart editable, inside the thermometer shapes. The user can customize the shapes and the charts in every property.
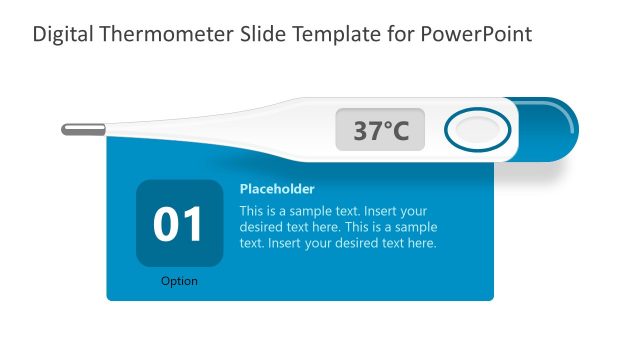
Ideal for representing medical statistics, virus statistical numbers or epidemiological information, this creative PowerPoint chart will engage your audience. When presenting biological topics this PowerPoint Charts can be composed with additional science shapes like our Microscope & Biology Shapes for PowerPoint
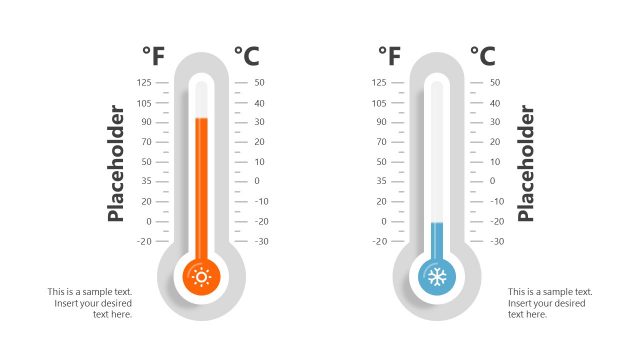
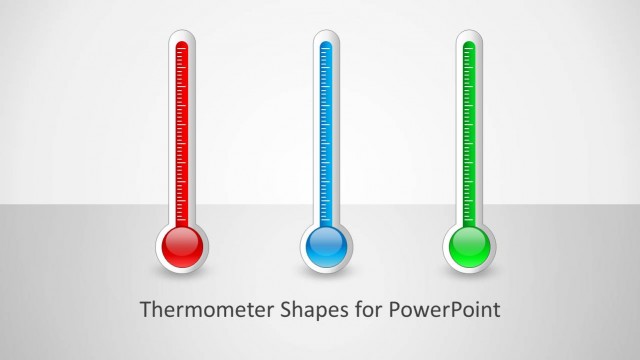
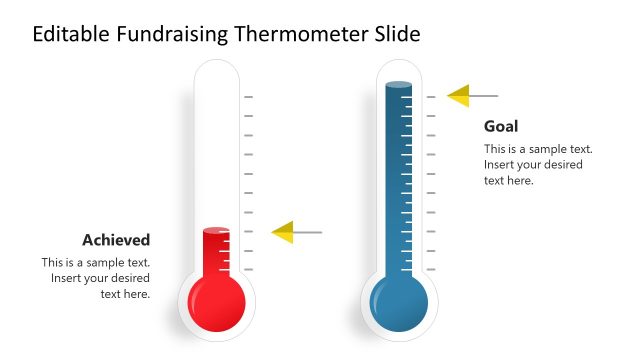
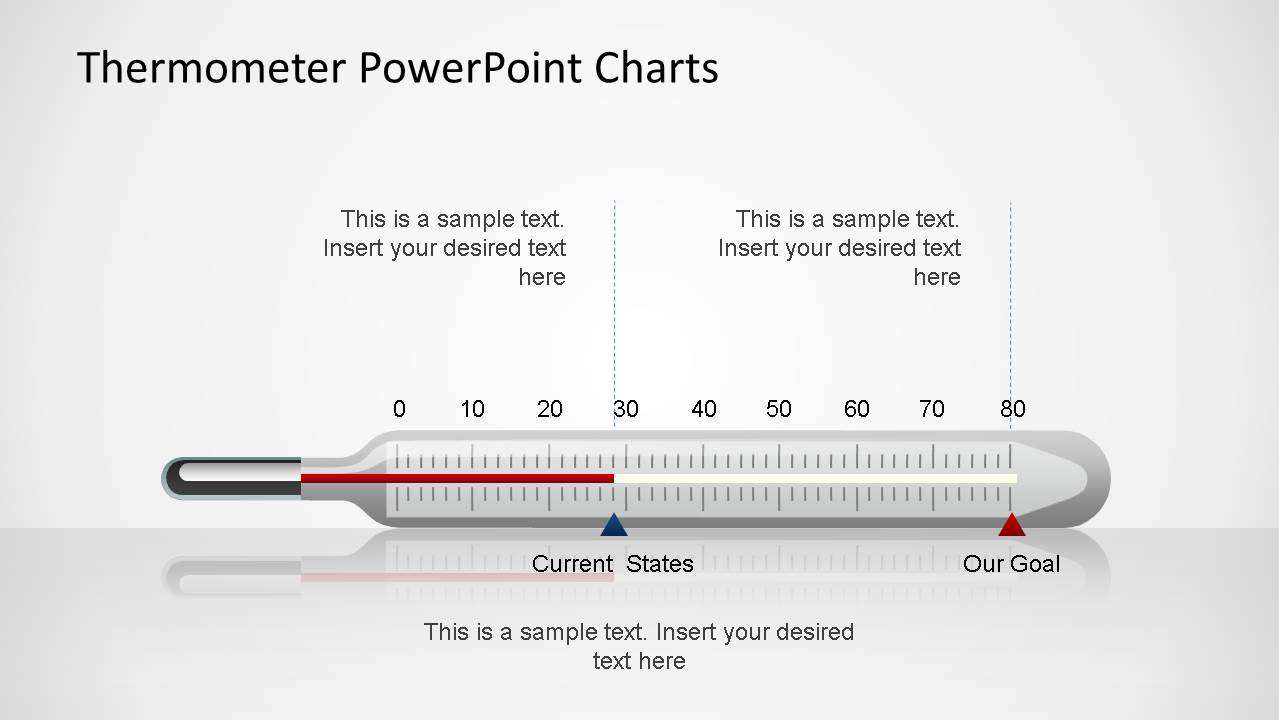
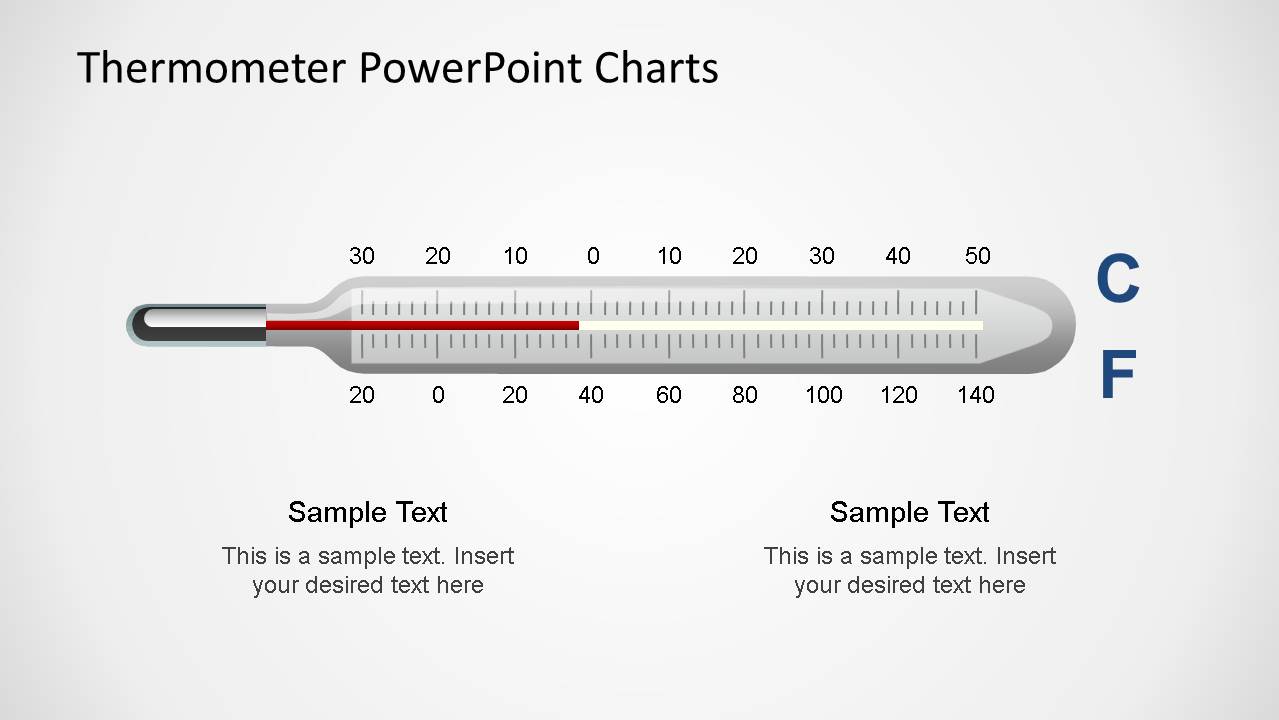
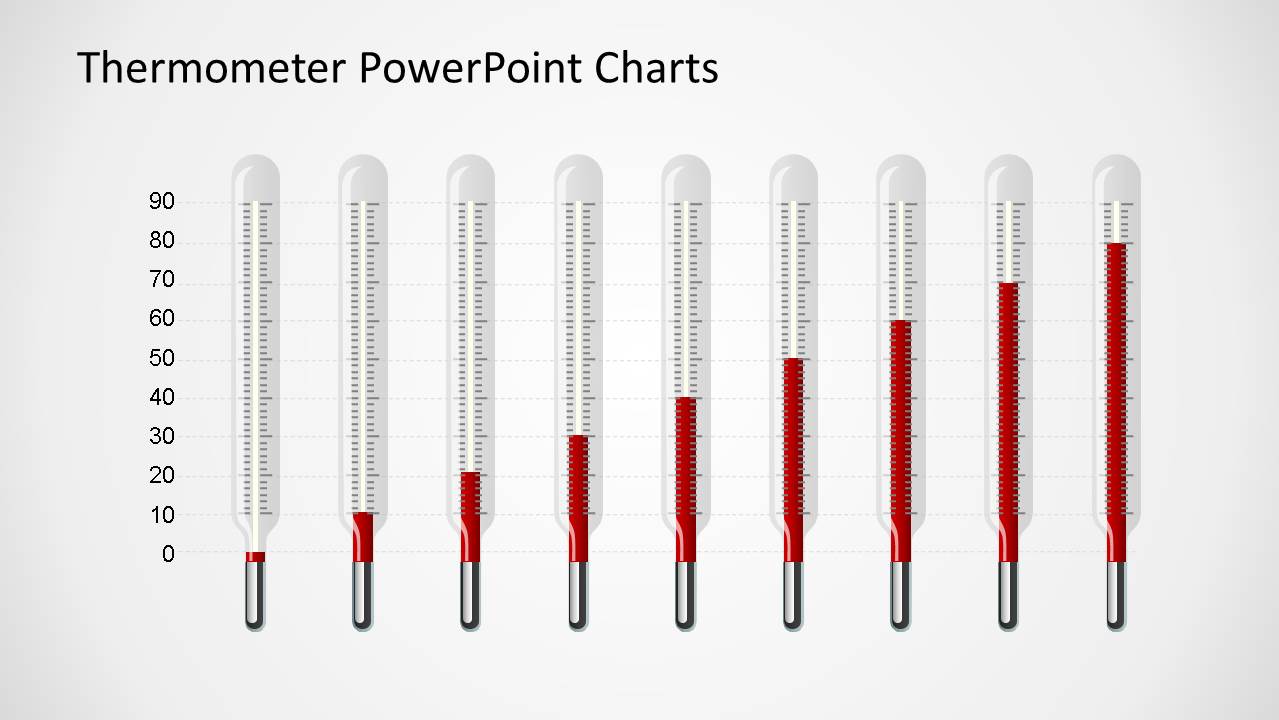
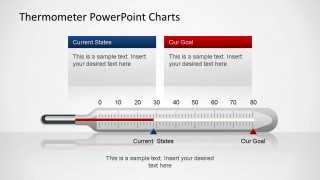
The thermometer shapes is a crystal mercury vintage representation, using number from 0 to 80 degrees, ideal for Celsius or Fahrenheit scales. The Bar Charts are Vertical and horizontal, but as the shapes can be rezized and rotated the user can create different charts with the same set of shapes.
The user can create awesome PowerPoint Presentations combining this Thermometer PowerPoint Chart with our Thermometer PowerPoint shapes created as vintage colorful alcohol thermometers.


You must be logged in to download this file.
DOWNLOAD- Category
- Data & Charts
- Rating


 Loading...
- Size
- 16x9
- Item ID
- 6495-01
- Colors
Subscribe today and get immediate
access to download our PowerPoint templates.