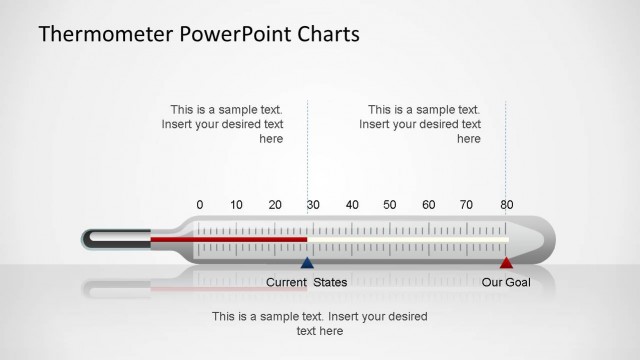
Thermometer PowerPoint Horizontal Chart
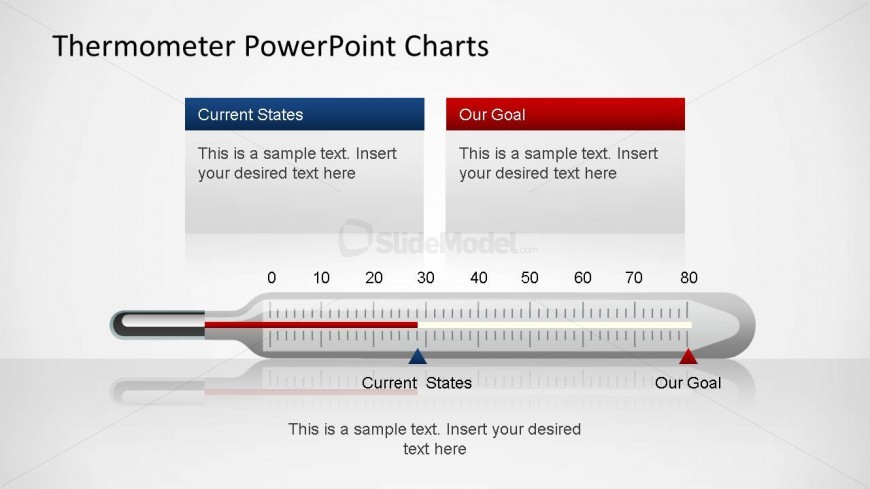
This creative Thermometer PowerPoint Horizontal Chart is an editable bar chart slide, where the user can edit the red bar inside the shape and represent a number in the scale. the scale and the shape are also editable as they are created as PowerPoint objects. There are two milestone markers, blue and red, to represent start and end of a period withing the scale. The thermometer shapes has a transparent shadow.There are tow text boxes with colorful headings (blue and red).
Return to Thermometer PowerPoint Charts.