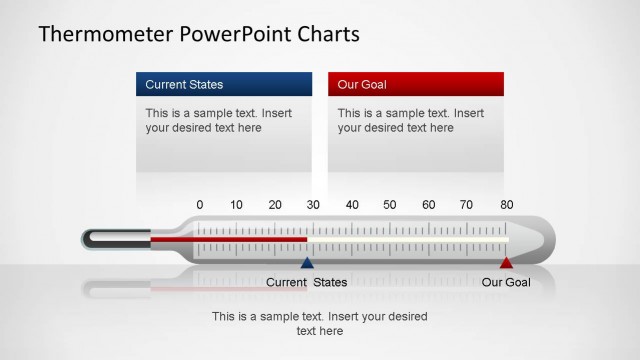
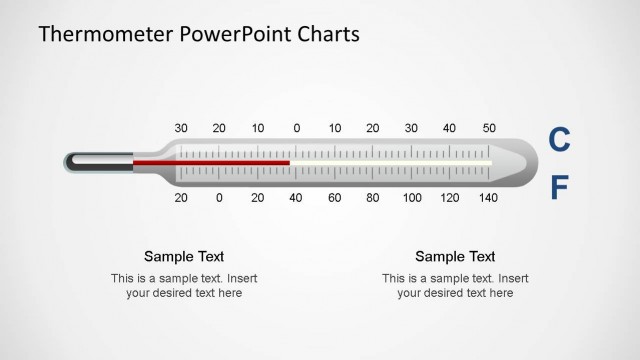
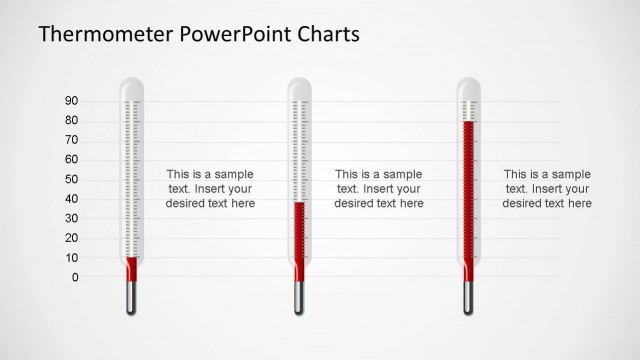
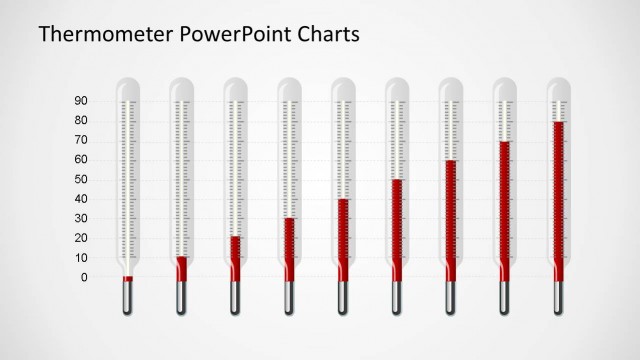
Thermometer Horizontal Bar Chart for PowerPoint
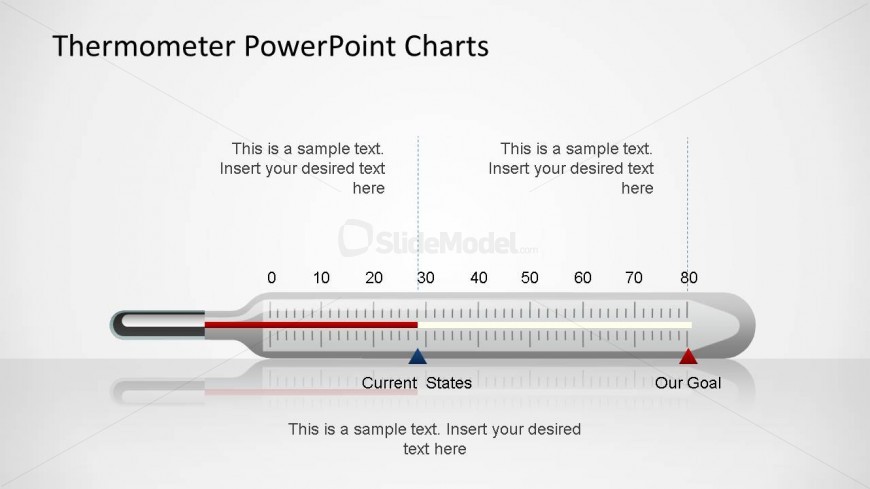
This thermometer horizontal bar chart for PowerPoint is a simple slide with a creative crystal mercury thermometer shape representing and horizontal chart. The user can edit the red bar to increase or decrease the chart value. Every shapes is created as PowerPoint object to be fully customizable.
Return to Thermometer PowerPoint Charts.