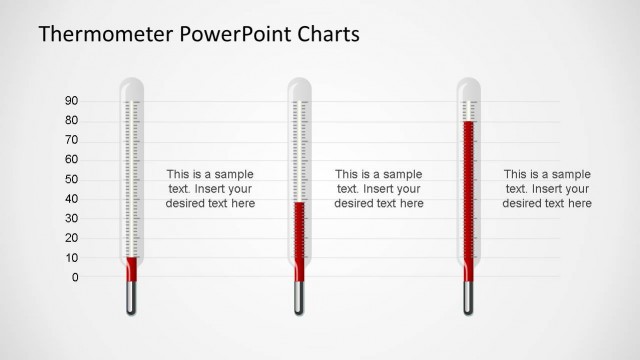
Vertical Thermometer Bar Chart Nine Bars

Vertical Thermometer Bar Chart with Nine bars in cumulative burn up.

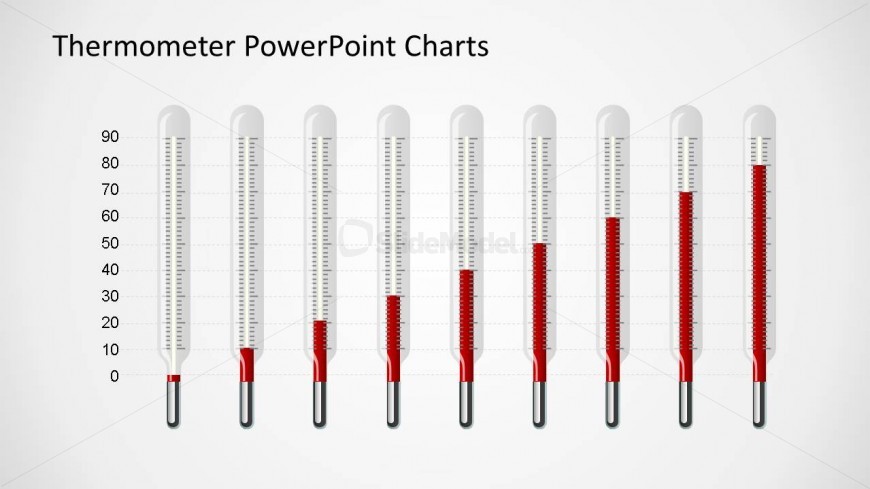
Professional Vertical Thermometer Bar Chart with Nine bars in cumulative burn up. This slide is an accurate data chart, where each data bar is represented by a crystal thermometer with a red PowerPoint bar inside used to show the numerical value of the series. Impress your audience with this outstanding PowerPoint Chart and engage your audience with ready made PowerPoint templates that will save you tons of time.

Return to Thermometer PowerPoint Charts.

Activate your subscription

Download unlimited PowerPoint templates, charts and graphics for your presentations with our annual plan.

DOWNLOAD

Slide Tags:

Axis Bar Chart Crystal Degrees Glass Goal Gridlines Mercury Milestone Series Shadow States Textbox Textbox Descriptions Thermometer Vertical X Axis Y Axis

Return to Thermometer PowerPoint Charts.

Download Unlimited Content

Our annual unlimited plan let you download unlimited content from SlideModel. Save hours of manual work and use awesome slide designs in your next presentation.

Subscribe Now