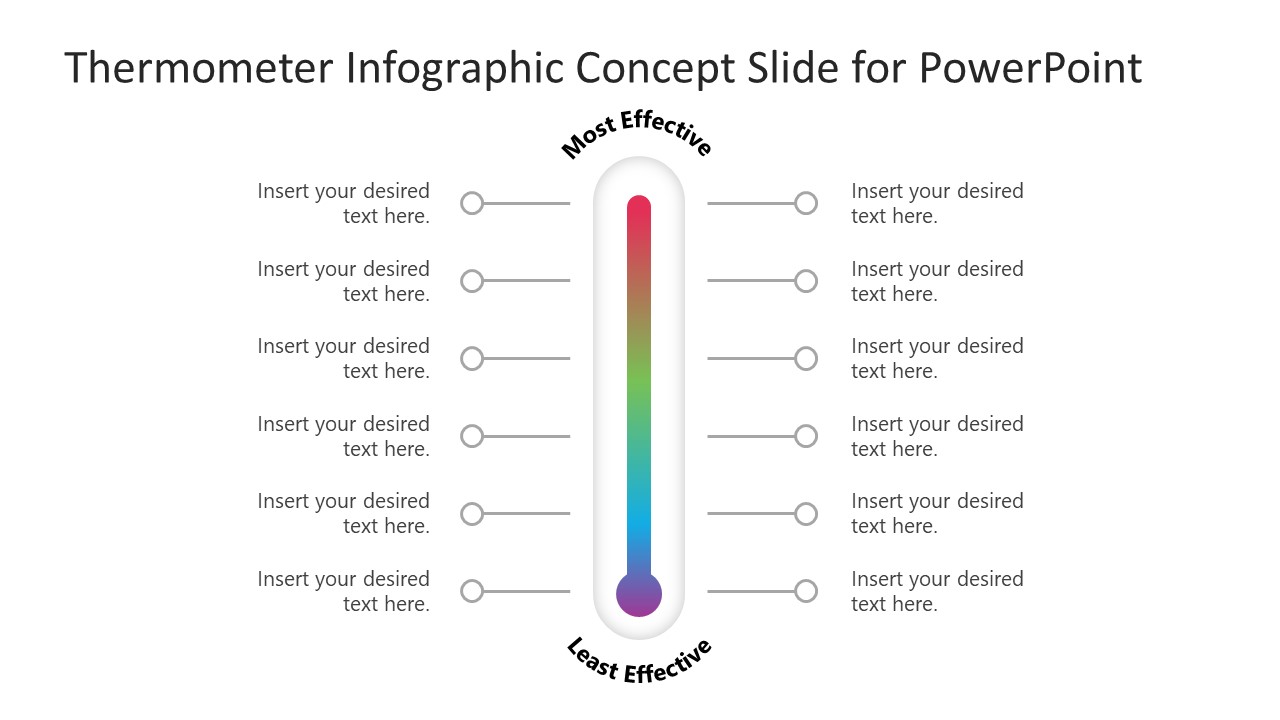
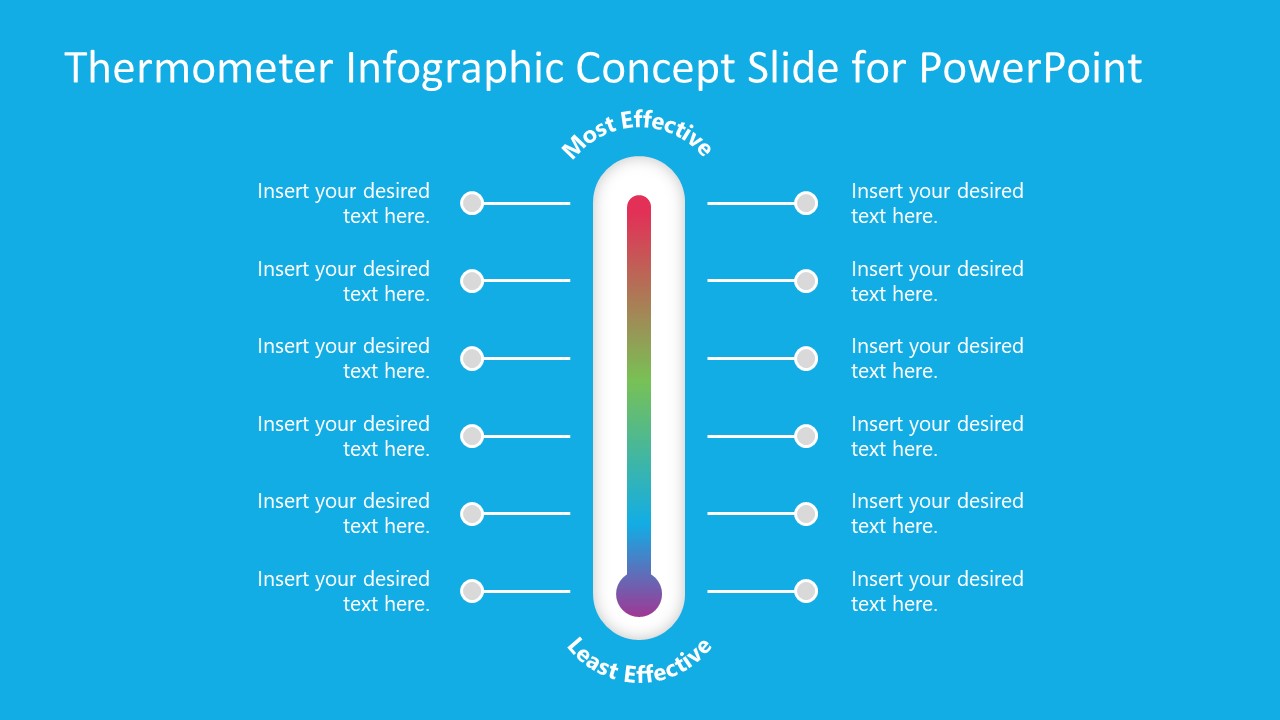
Thermometer Infographic Template for PowerPoint
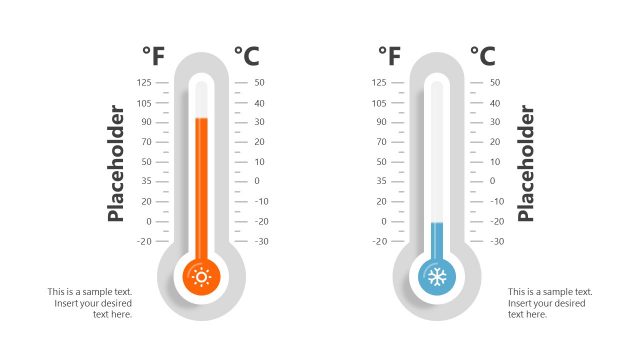
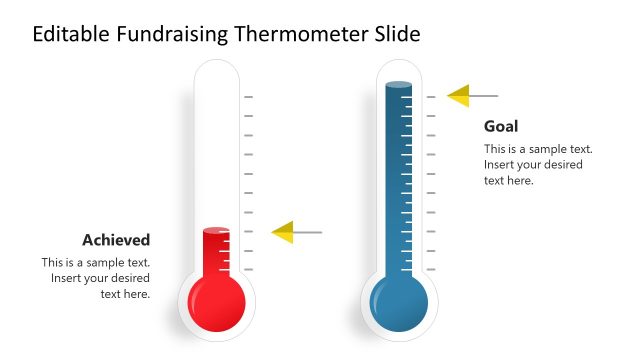
Thermometer Infographic Template for PowerPoint is an editable diagram design for temperature readings. The thermometer is a device, designed to measure temperature to see how hot or cold something is. The image of thermometer is used as a metaphor for visualizing the rate between two extremes. Similar to cold and hot temperatures, thermometer can describe values such as high/low, good/bad, profit/loss, and more. The diagram of thermometer infographics presents labeling lines on both sides for chart readings of Celsius and Fahrenheit. In business presentations, you can add thermometer infographics in business reports or corporate dashboards to describe key metrics.
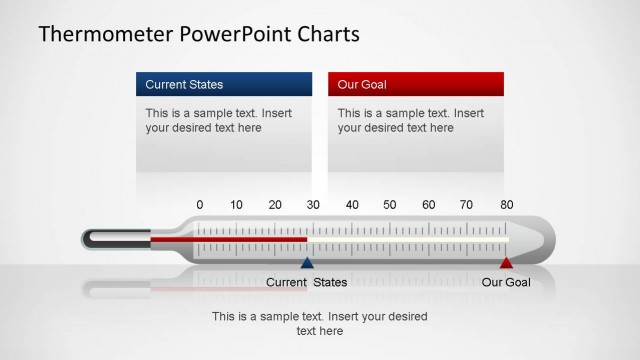
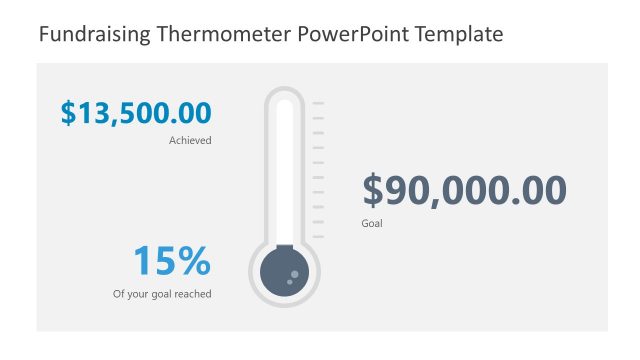
Thermometer Infographic Template for PowerPoint is suitable for demonstrating key indications in the organization. In a sales report, for example, you can present threshold, qualified sales, and sales target on the thermometer to measure progress. Non-Profit organizations use Thermometer infographics in fund raising presentations. It can show the goal of fundraising and the original amount received using temperature chart readings.
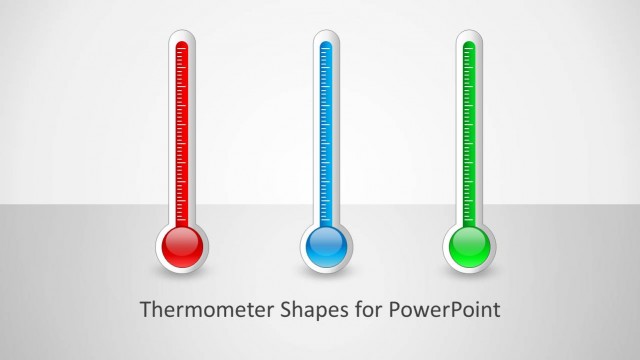
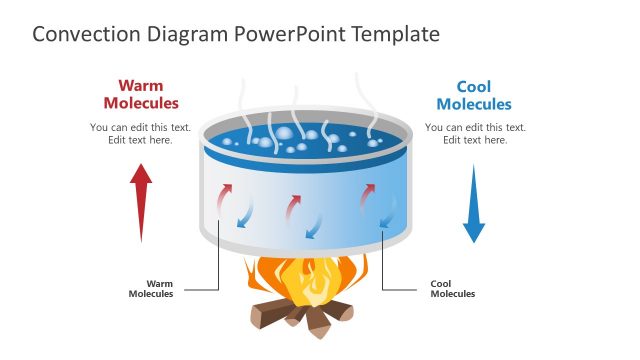
The infographic PowerPoint Template of thermometer is also useful for comparing wide variety of quantitative results. The values on Celsius and Fahrenheit scale can display different process measures. The diagram is a well-designed infographic for business and academic presentations. Business analysts and managers use thermometer infographic PPT for reporting purposes. Educators also use thermometer infographic diagram for several temperature measuring topics in biology, geology, and chemistry. Alternatively, you can download other thermometer templates for goals and fundraising presentations.
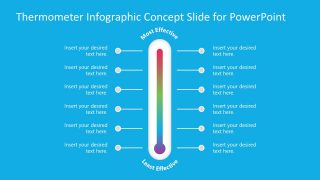
Thermometer Infographic Template for PowerPoint has two slides with white and blue background options. The gradient stripe in the middle represents the temperature range from least effective to most effective. You can add multiple values at each labeling unit to discuss outcomes or impact at each stage.
You must be logged in to download this file.
DOWNLOAD- Category
- Shapes
- Rating

 Loading...
- Size
- 16x9
- Item ID
- 21092-01
- Colors
Subscribe today and get immediate
access to download our PowerPoint templates.