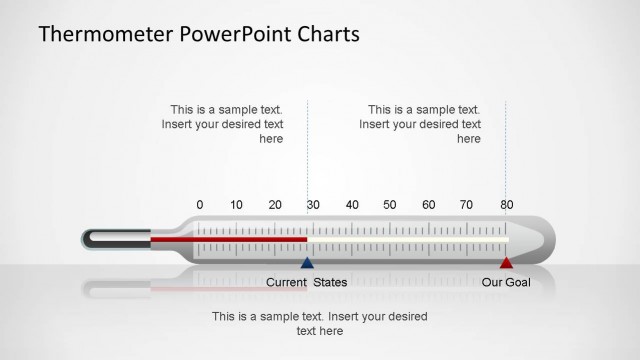
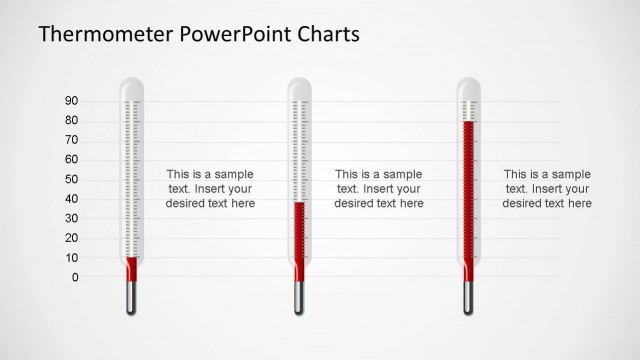
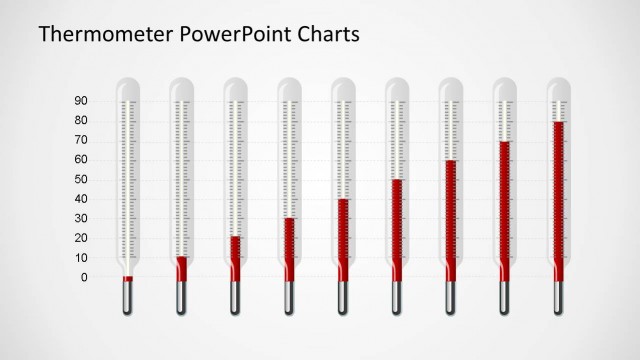
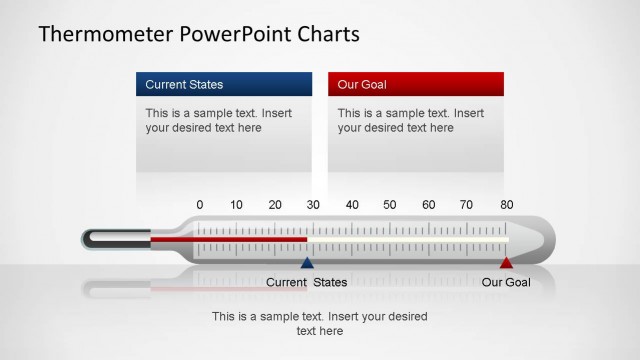
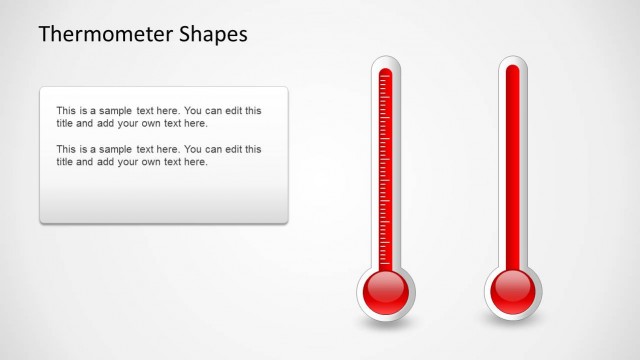
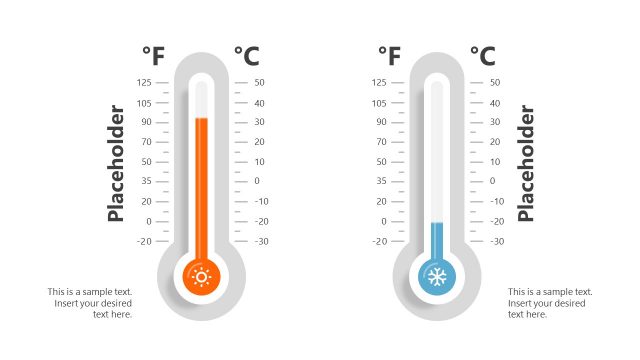
Thermometer Bar Chart Celsius and Fahrenheit
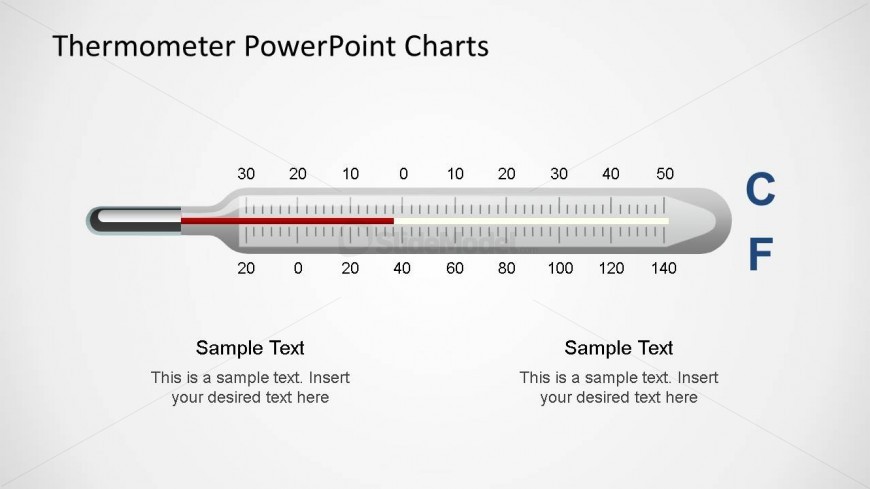
This slide contains a Thermometer Bar Chart Celsius and Fahrenheit scales. The shapes is created as a composite of PowerPoint objects. The chart is editable, as the scales values and text boxes.
Return to Thermometer PowerPoint Charts.