Product Life Cycle Model PowerPoint Diagram – This professional PowerPoint Template presents a 100% editable diagram of the product life cycle (PLC) curve, with each of the phased described in individual slides.
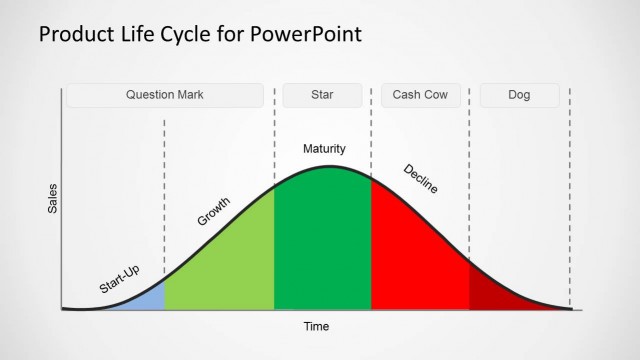
The Product Life Cycle is a model created to represent the phases of a product from it’s ideation to be discontinued. The model is broad enough to be applied across a product category or in the context of an individual product. The model is a simple but powerful Strategy tool that helps organizations to plan new product development and evolve existing products.
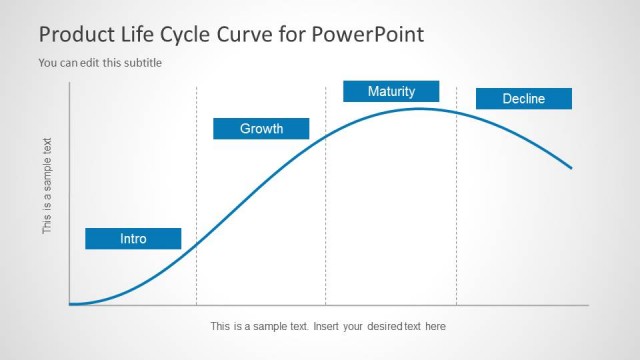
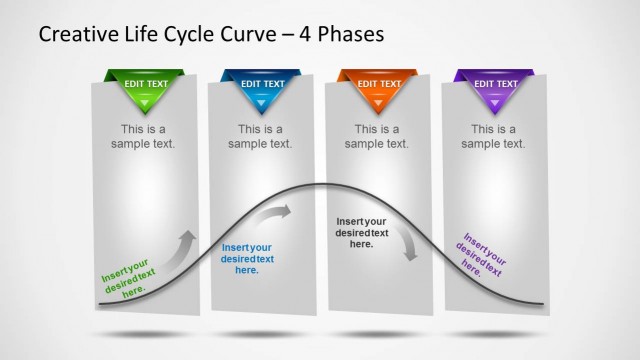
The Global Product Life Cycle Model is divided in four main stages (a modern representation includes a fifth phase added recently to describe inclusion of innovation within the product process. The stages are the following:
- Introduction
- Growth
- Maturity
- Decline
- Reinvention
This model is used generally during strategic planning or during the review of a business model. It provides a clear map of in which stage the organization’s products/services have reached. During the Product Life Cycle analysis a complementary tool is the BCG Matrix.
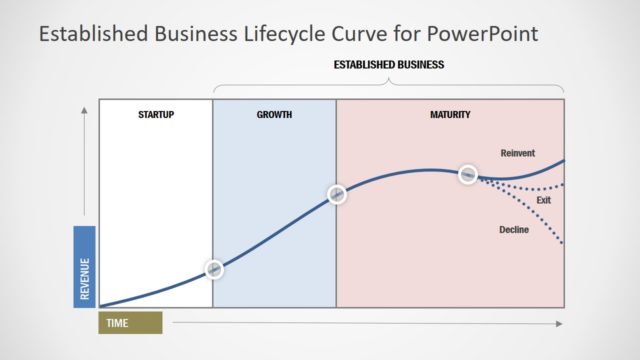
The Product Life Cycle Model helps to understand and to plan the sales forecast. Products in the early stages of the model are prone to have increasing sales as the product matures. When it reaches the maturity stage, sales will stop growing, but for a period (until the decay phase is reached) they will keep the sale volume high. Predicting the Decay phase is generally difficult but understanding that a product has reached maturity prepares the organization for the next product and to diversify it portfolio.
The Product Life Cycle Model PowerPoint Diagram is a professional PowerPoint Template, ready to edit and designed with the best layout practices. Users just need to replace the text placeholders with their content text and they are ready to describe their Product Life Cycle. Impress your audience with professional PowerPoint Diagrams that engage and generate durable messages.
What’s inside this template
Example presentation scenarios
- A product manager can use the four-stage life cycle curve to explain where a product sits today and what decisions are needed before the next planning cycle.
- A strategy consultant can use the five-point maturity curve with reinvention to show executives how a declining offer may be refreshed instead of retired.
- A marketing leader can use the introduction and growth phase detail panels to align campaign planning with product development, testing, deployment, versioning, and implementation activities.
- A portfolio review presenter can use the maturity and decline panels to separate sustaining work, support requirements, and reengineering options for products at different stages.
Features
- 100% editable presentation template
- Compatible with Microsoft PowerPoint and Google Slides
- 16:9 aspect ratio slides
- Scalable vector shapes, icons and illustrations
- AI-Ready for Microsoft Copilot and Claude
- Instant access and download
Frequently asked questions
Q: How should a presenter structure a product life cycle message with this template?
A: Start with the overview curve to define the full journey, then move into the phase slides only for the stages that need decisions. Use the introduction, growth, maturity, decline, and reinvention panels as discussion frames: what is happening now, what work is required, and what management decision follows.
Q: Who is this template best suited for in a planning meeting?
A: It fits product managers, portfolio owners, consultants, and marketing leaders who need to explain stage-based product decisions to executives or cross-functional teams. The curve diagrams make the maturity position visible, while the phase detail panels give each team a clear place to discuss product development, support, reengineering, or reinvention work.
Q: Why does the curved life cycle metaphor help communicate product maturity?
A: The rising and falling curve gives the audience an immediate visual model for growth, peak maturity, and decline. Numbered callouts turn that curve into a guided explanation, and the separate phase panels prevent the presenter from crowding every operational detail onto the overview slide.


Product Life Cycle Model PowerPoint Diagram
9-slide presentation template for product life cycle curves, maturity stages, and phase planning diagrams
This 9-slide product life cycle diagram template shows a PLC curve, two-model comparison, four-stage overview, and individual phase detail layouts for introduction, growth, maturity, decline, and reinvention. It is for product managers, strategy teams, and consultants building Microsoft PowerPoint or Google Slides presentations with editable shapes and vector icons.
- Category
- Process Diagrams
- Rating


 Loading...
- Aspect ratio
- 16:9, 4:3
- Item ID
- 6797-03
- Colors
 Microsoft PowerPoint
 Microsoft Copilot
 Claude for PowerPoint
Other formats supported
Subscribe today and get immediate
access to download our PowerPoint templates.