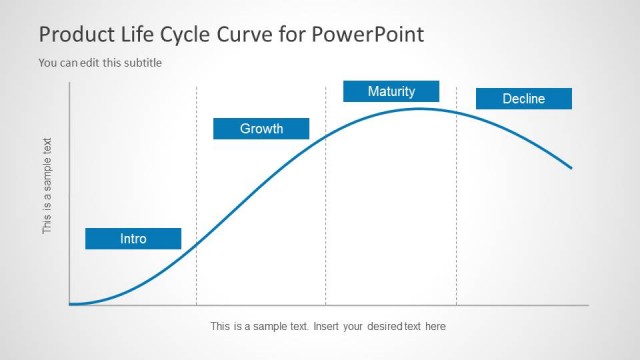
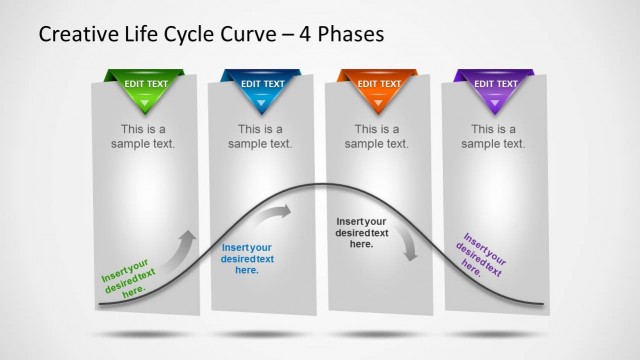
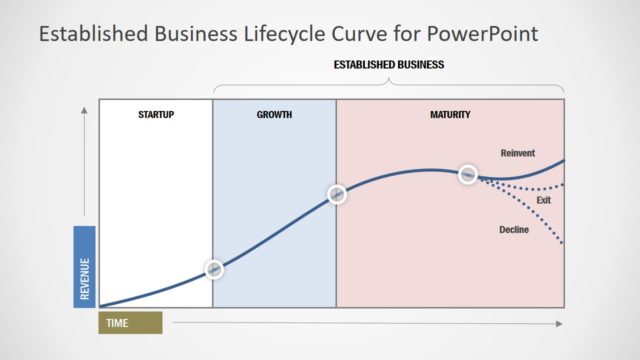
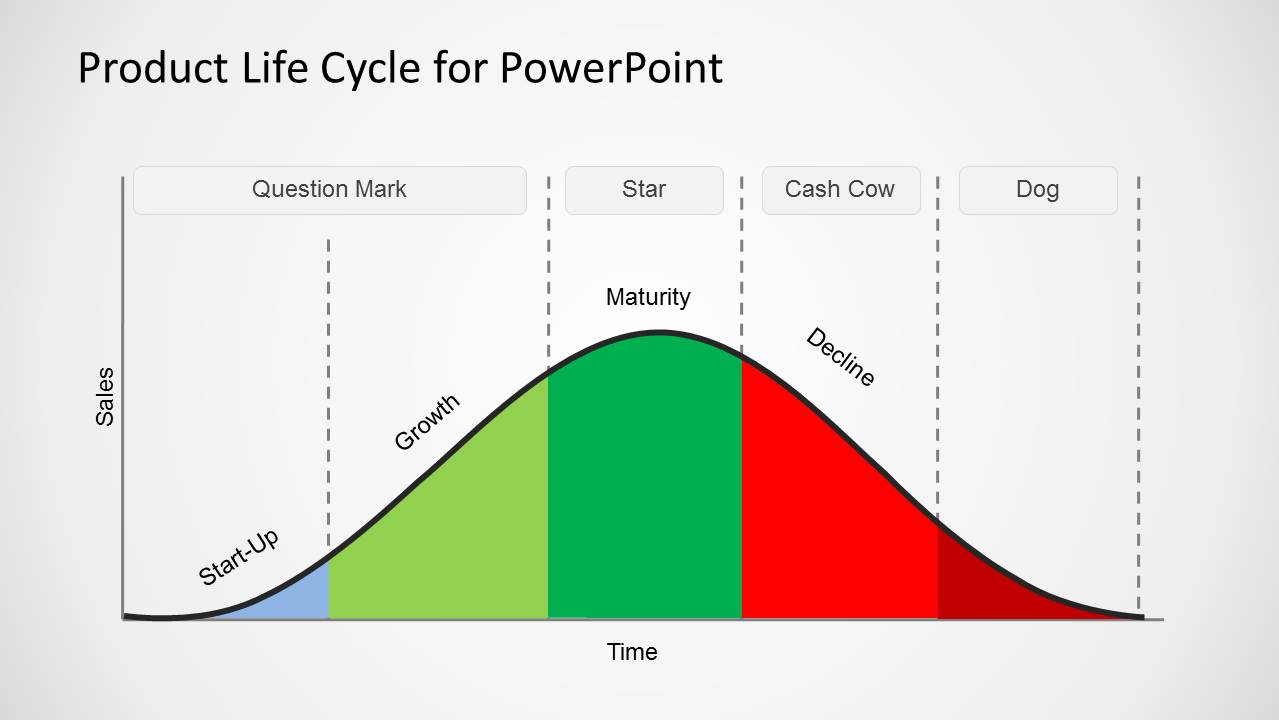
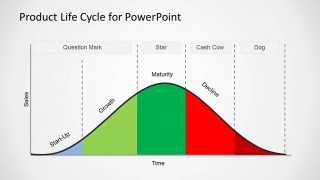
Product Life Cycle Template for PowerPoint is a PowerPoint presentation design that you can use to represent a product life cycle or business life cycle using PowerPoint shapes and combining it with the Boston Consulting Group matrix or growth-share matrix template. This template for PowerPoint contains nice curve design that you can use to model product life cycle stages.
The presentation template has dotted lines to separate each stage and you can find editable text boxes to add your own descriptions as well as labels for each of the stages: Intro or Startup, Growth phase, Maturity and Decline.
What’s inside this template
Example presentation scenarios
- A product manager can use the full color life cycle curve to brief executives on where a product sits between startup, growth, maturity, and decline.
- A strategy consultant can use the BCG labels across the curve to connect product stage discussions with Question Mark, Star, Cash Cow, and Dog portfolio categories.
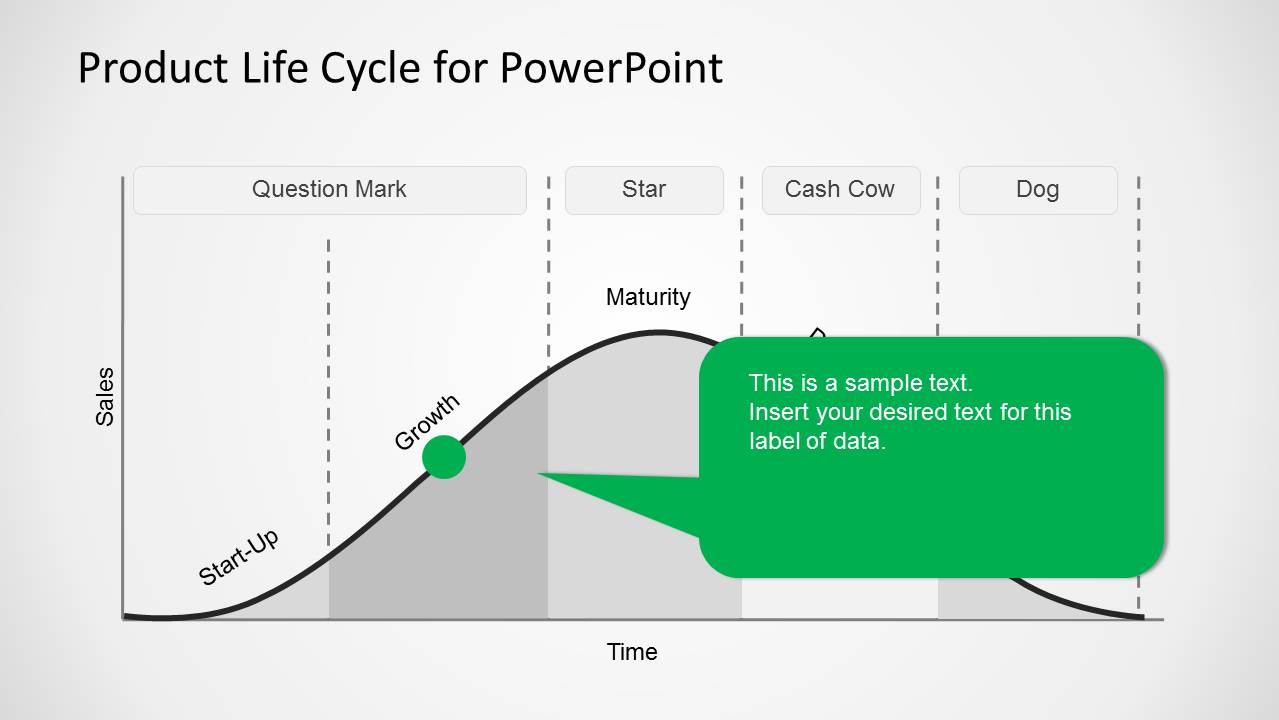
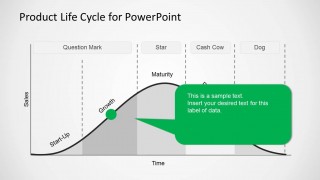
- A marketing leader can use the green growth and maturity callout slides to explain messaging priorities, investment focus, or channel planning at specific points on the curve.
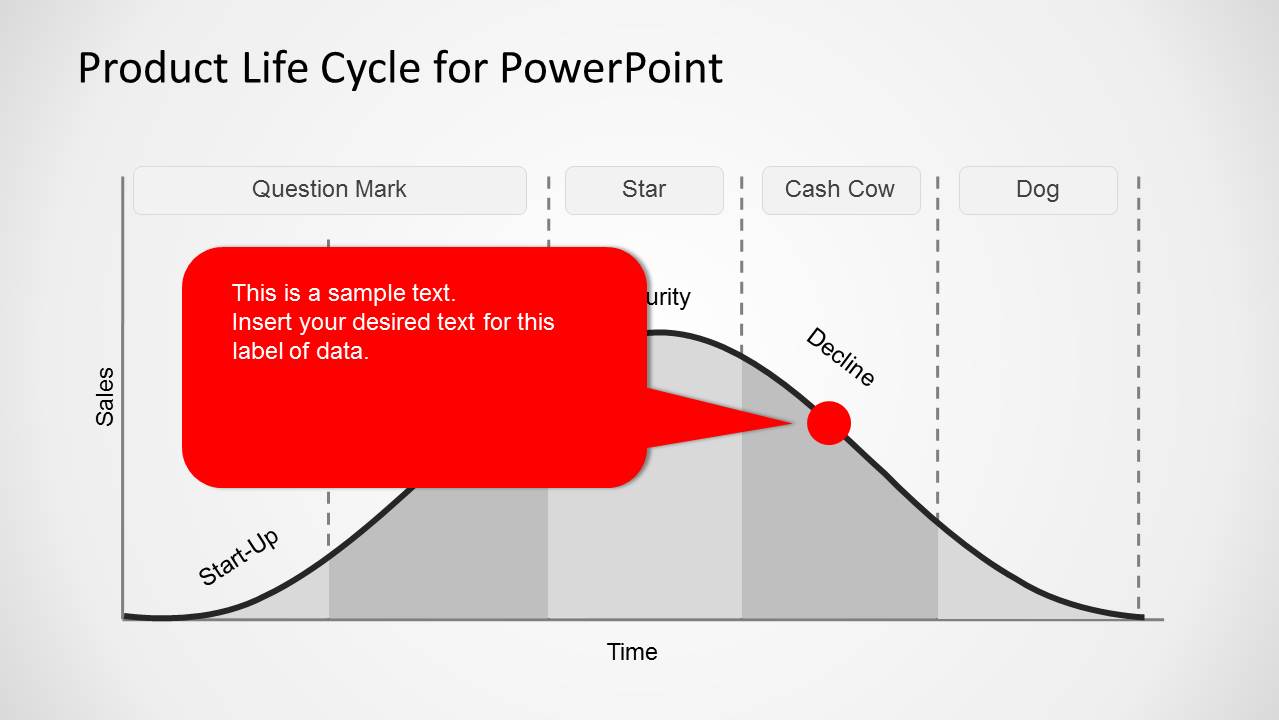
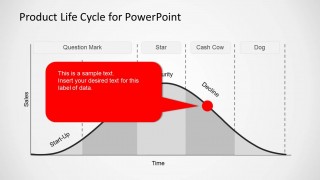
- A business unit lead can use the red decline callout slide to frame decisions about repositioning, harvesting, replacement, or exit planning.
Features
- 100% editable presentation template
- Compatible with Microsoft PowerPoint and Google Slides
- Scalable vector shapes, icons and illustrations
- AI-Ready for Microsoft Copilot and Claude
- Instant access and download
Frequently asked questions
Q: How should a presenter explain the product life cycle without making the curve feel too theoretical?
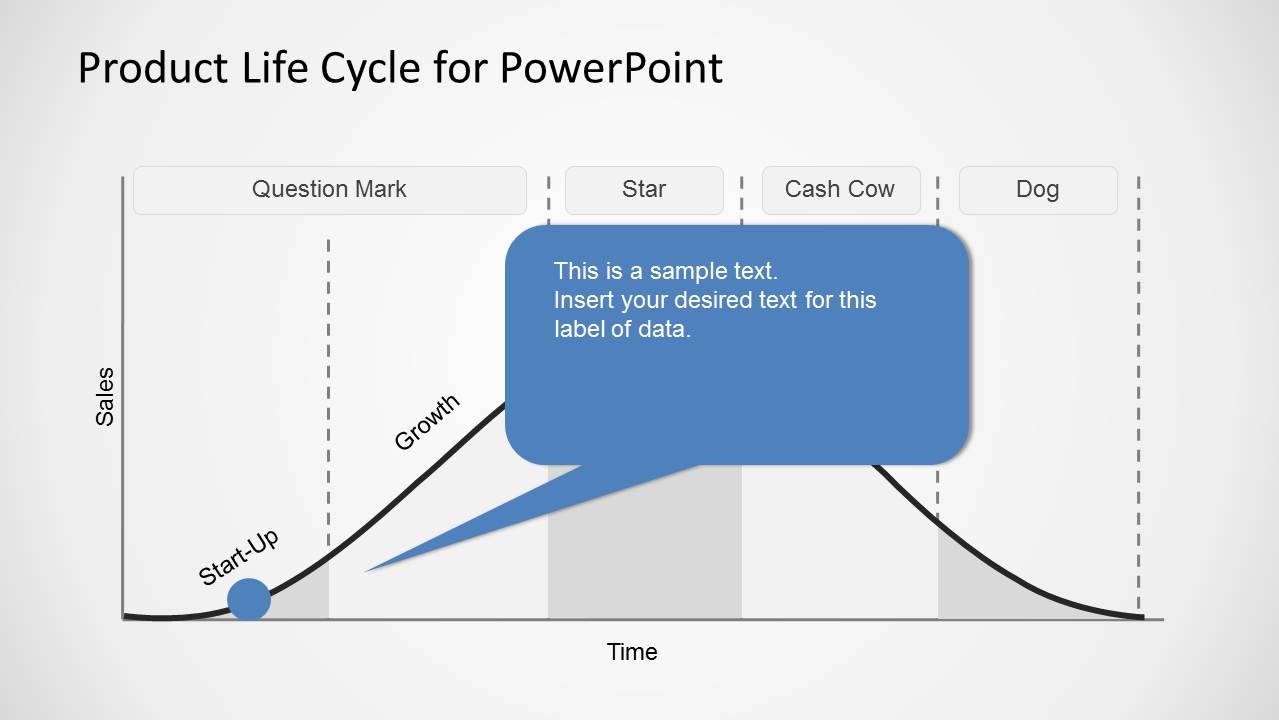
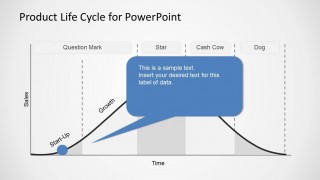
A: Start with the full color curve to define the four visible stages, then move to the annotated slides to connect each stage to a real product decision. Use one callout per slide for the main implication, such as funding growth, defending maturity, or managing decline. This keeps the model tied to action rather than abstract theory.
Q: Who is this template best suited for in a business presentation?
A: This template fits product managers, consultants, marketing teams, and executives who need to discuss product stage, portfolio role, or market behavior. The BCG labels help audiences connect the life cycle curve to strategy language, while the callout slides support focused discussion of one stage or decision point at a time.
Q: Why combine a life cycle curve with BCG matrix labels?
A: The curve shows time-based movement from startup to decline, while the BCG labels add portfolio meaning above each phase. This pairing helps audiences see both the product's maturity path and its strategic category. The visual metaphor makes the discussion easier to follow than a text-only stage list.


Product Life Cycle Template for PowerPoint
5-slide PowerPoint presentation template for product life cycle and BCG matrix phase diagrams
This 5-slide PowerPoint template presents a product life cycle curve with BCG growth-share labels, sales and time axes, stage dividers, colored phase bands, and callout annotations. It is for product managers, strategists, and consultants explaining startup, growth, maturity, and decline stages in PowerPoint.
- Category
- Business PowerPoint Templates
- Rating


 Loading...
- Item ID
- 6224-01
- Colors
 Microsoft PowerPoint
  Microsoft Copilot
  Claude for PowerPoint
 Other formats supported
Subscribe today and get immediate
access to download our PowerPoint templates.