The MUDA 7 Types Of Waste PowerPoint Template is a slide template created for consultants, professionals or executives that need to present the seven types of waste (also known as Muda) and specify in detail each of them. The PowerPoint template provides the following assets to presenters:
- Cover slide to start the presentation with a descriptive Clipart. It features a Pie chart providing insights of the content of the deck.
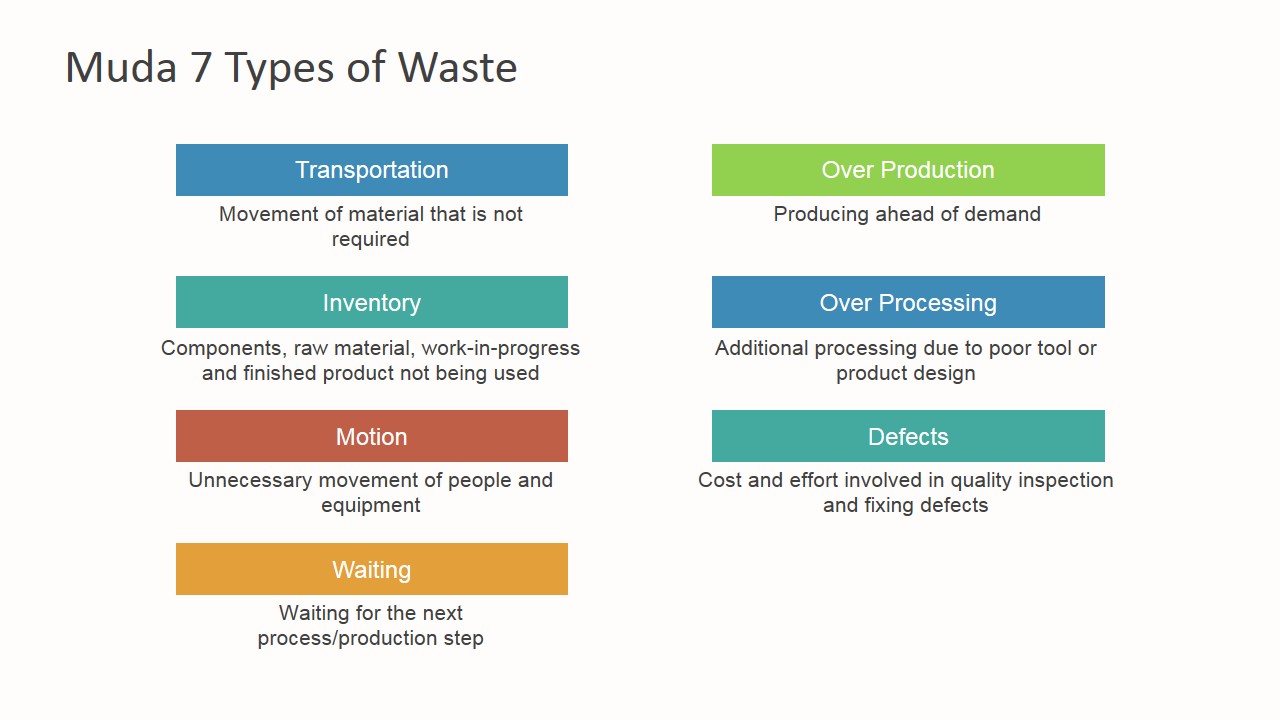
- Seven Types of Muda Titles are displayed in a two-column, four-row layout and decorated with a warm flat palette.
- Visual Metaphors in the form of PowerPoint Icons and Clipart Picturing the 7 Muda Types of Waste.
- Pie Chart Infographic to present the quantitative analysis of each Muda type’s waste.
- One slide for each Muda Type was created with a two-vertical tile layout.
In business and management, Muda is a Japanese word meaning wastefulness. It was first introduced as a business jargon by the Toyota Production System (TPS) 3M’s model. It is one of the three M’s that attain for Muda (waste), Mura (overburden) and Mura (unevenness). Muda has become popular because of various reasons, a couple would be:
- Reducing waste is the most effective way of improving profitability, and there is an extensive set of management tools to identify and optimize it.
- Lean movements traction and momentum. Lean practitioners have adopted Muda as their main mantra, and are extremely successful in identifying and correcting processes in time efficient way and with good results.
The Types of Muda or waste categories varies; they depend of the management quality framework. In the traditional TPS model, the wastes types described by Taiichi Ohno (Toyota’s Chief Engineering Officer) are the following seven:
- Transportation
- Inventory
- Motion
- Waiting
- Over Production
- Over Processing
- Defects
The Muda 7 Types Of Waste PowerPoint Template provides a cohesive presentation where users can quickly build a Muda Analysis and present it to their board or interested stakeholders.
What’s inside this template
Example presentation scenarios
- A Lean consultant can use the two-column definition list to introduce Muda categories before facilitating a waste identification workshop with process owners.
- An operations manager can use the segmented pie chart infographic to frame a discussion about which waste categories appear most often in a production process.
- A quality manager can use the seven icon-led detail slides to explain transportation, inventory, motion, waiting, over production, over processing, and defects during a Six Sigma meeting.
- A manufacturing executive can use the icon grid summary to brief stakeholders on Lean focus areas before requesting improvement initiatives from department leads.
Features
- 100% editable presentation template
- Compatible with Microsoft PowerPoint and Google Slides
- 16:9 aspect ratio slides
- Scalable vector shapes, icons and illustrations
- AI-Ready for Microsoft Copilot and Claude
- Instant access and download
Frequently asked questions
Q: How should a presenter explain the seven waste categories without making the session repetitive?
A: Start with the two-column definition slide to establish shared vocabulary, then use the icon grid as a memory aid before moving into the individual detail slides. Keep each category tied to one real process example. This turns the seven repeated layouts into a guided diagnostic discussion instead of a list of abstract Lean terms.
Q: Who is this Muda waste deck best suited for in a business presentation?
A: This deck fits Lean consultants, operations managers, and quality teams who need to teach or align stakeholders on waste categories before an improvement project. It works best when the audience already knows the process being discussed, because the slides provide the Muda framework while the presenter adds the specific workflow evidence.
Q: Why do the icon tiles and pie chart metaphor help communicate Muda analysis?
A: The icon tiles turn each waste type into a simple visual cue, making similar operational problems easier to remember and compare. The segmented pie chart metaphor suggests that total waste can be broken into identifiable parts. Together, the layouts help an audience move from definition to recognition to prioritization.



Muda 7 Types Of Waste PowerPoint Template
12-slide presentation template for Muda waste analysis with pie chart infographic and lean process icons
Muda 7 Types Of Waste PowerPoint Template is a 12-slide Lean process improvement presentation for explaining waste categories. It includes a cover with pie chart infographic, two-column Muda definition list, icon grid, segmented pie summary, and individual waste detail slides for consultants, operations teams, and executives using PowerPoint or Google Slides.
- Category
- Models
- Rating


 Loading...
- Aspect ratio
- 16:9, 4:3
- Item ID
- 6266-01
- Colors
 Microsoft PowerPoint
 Microsoft Copilot
 Claude for PowerPoint
Other formats supported
Subscribe today and get immediate
access to download our PowerPoint templates.