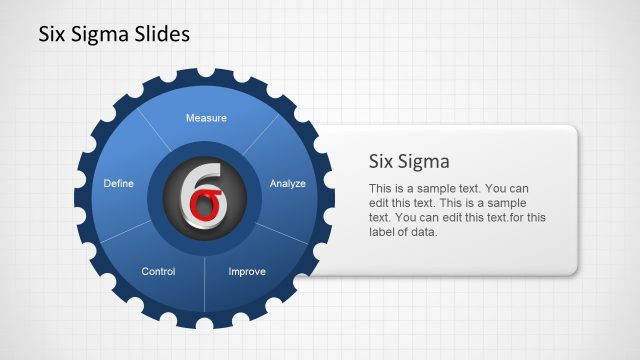
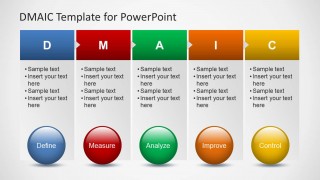
DMAIC Template for PowerPoint is a presentation template containing multiple DMAIC process slide designs. DMAIC stands for Define, Measure, Analyze, Improve, and Control and is a methodology based on these five improvement steps.
Lean Six Sigma DMAIC process starts with the Define step, where the problem is defined as the customer, the voice of the customer (VOC), and critical to quality (CTQ), then target process subject, and other related business processes, project targets or goals, the project boundaries, and scopes, as well as a project charter that is often created during the Define step.
Then, during the Measure process it is possible to establish current baselines as the basis for improvement, identify the gap between recent and required performance, and collect data to create a process performance capability baseline for the project metric. In the analysis process, the goal is to validate and select the root cause for elimination.
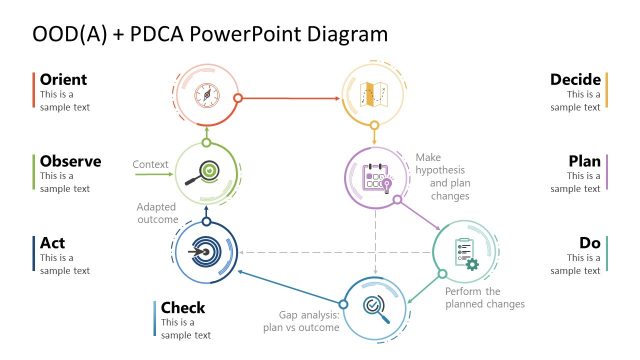
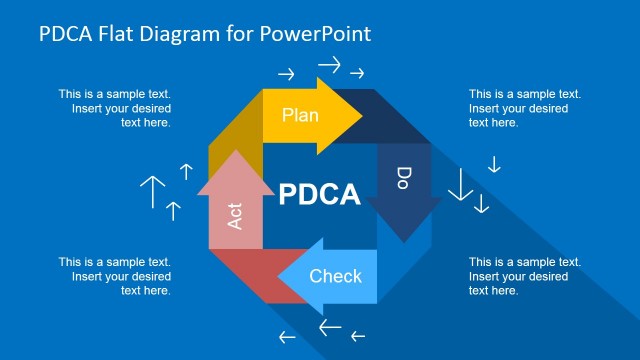
During the improvement process, the goal is to identify, test, and implement a solution to the problem. Here, you can use metaphors with creative slides for part or whole or design slides based on techniques like Six Thinking Hats or Random Word as an idea generation technique. During the Improve process step, you can create innovative solutions, focus on the most straightforward solutions, and use tools like the PDCA cycle to test solutions and get results.
During the Control step, the idea is to sustain the gains and monitor the improvements identified and measured to ensure continued and sustainable success. You can create a control plan and update any document or business processes as required here.
What’s inside this template
Example presentation scenarios
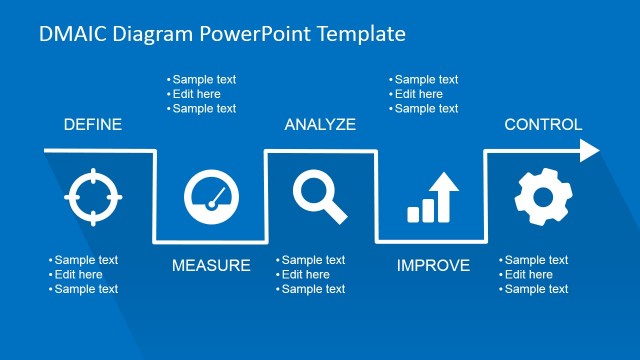
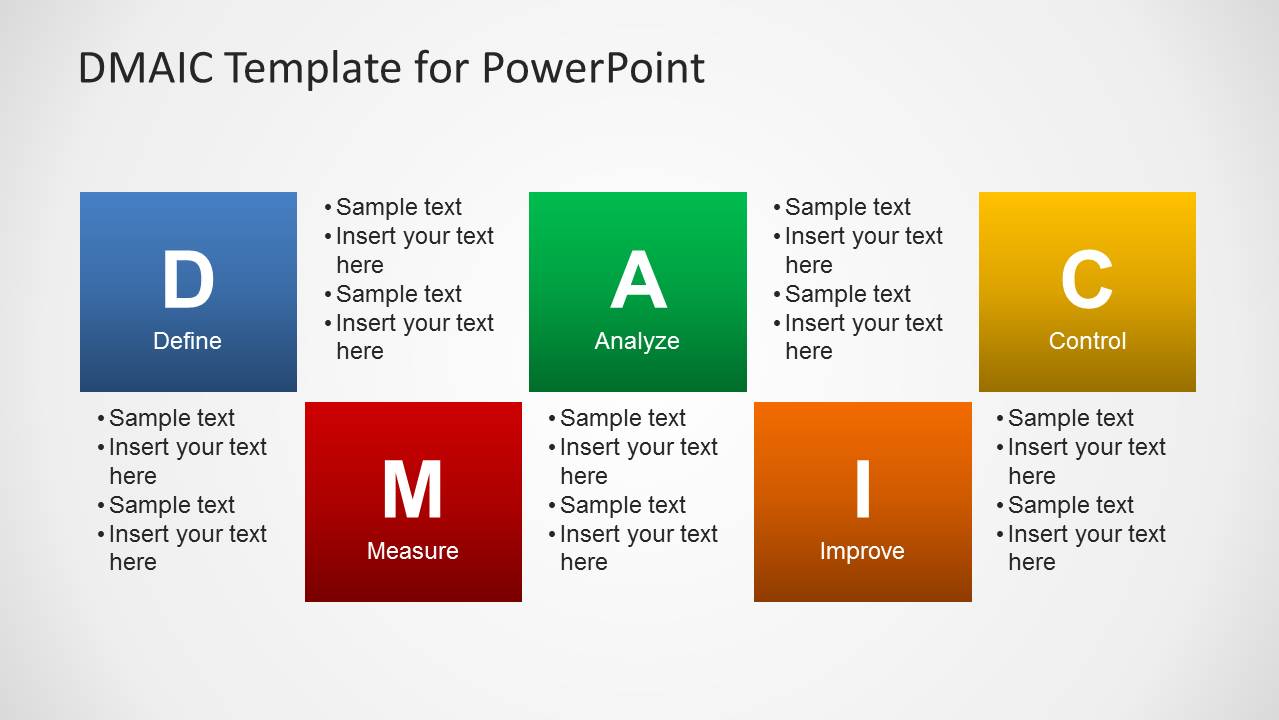
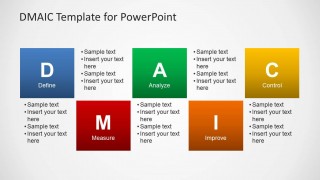
- A Lean Six Sigma facilitator can introduce a project charter by using the staggered DMAIC step block slide to connect the problem definition, measurement plan, and control expectations.
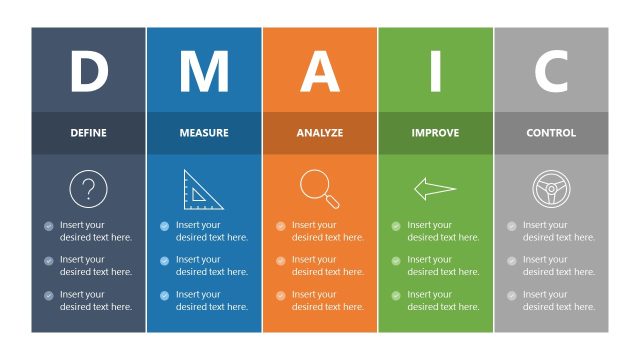
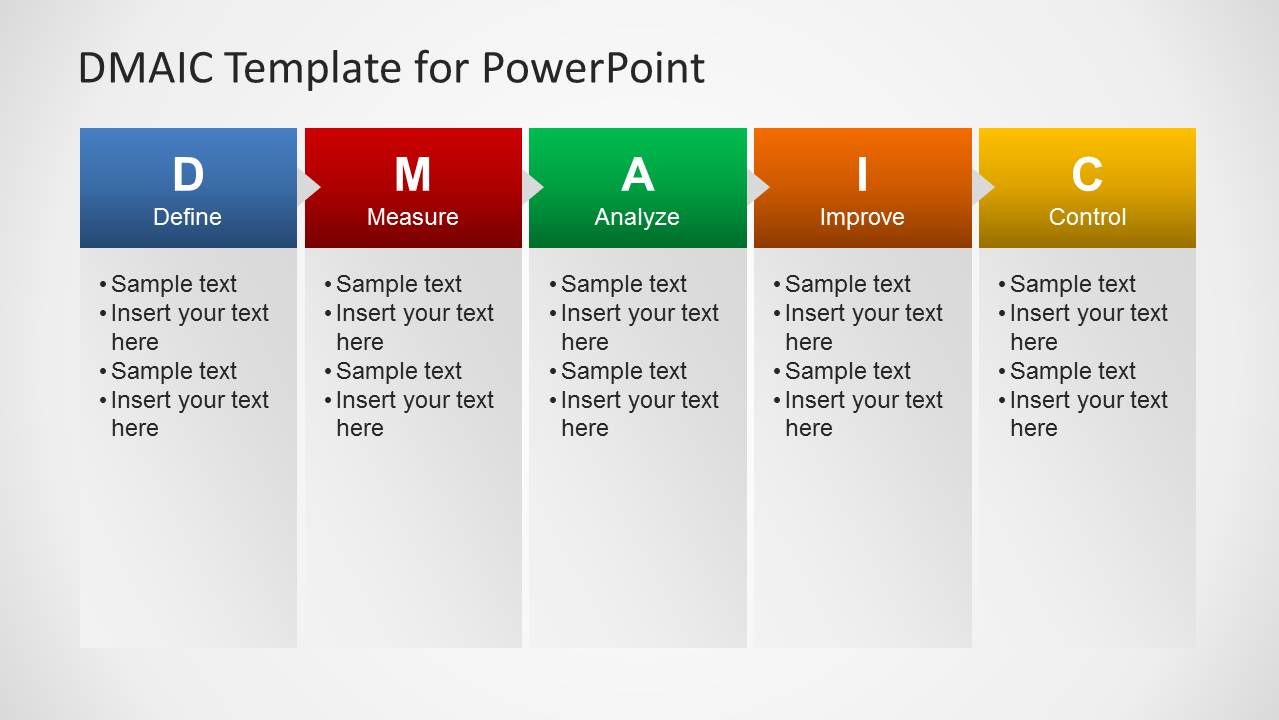
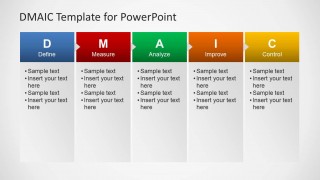
- An operations manager can brief executives on improvement progress by using the five-column DMAIC layout to show phase owners, key activities, and current status by stage.
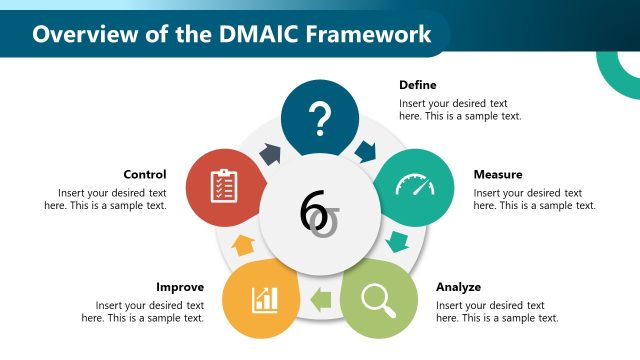
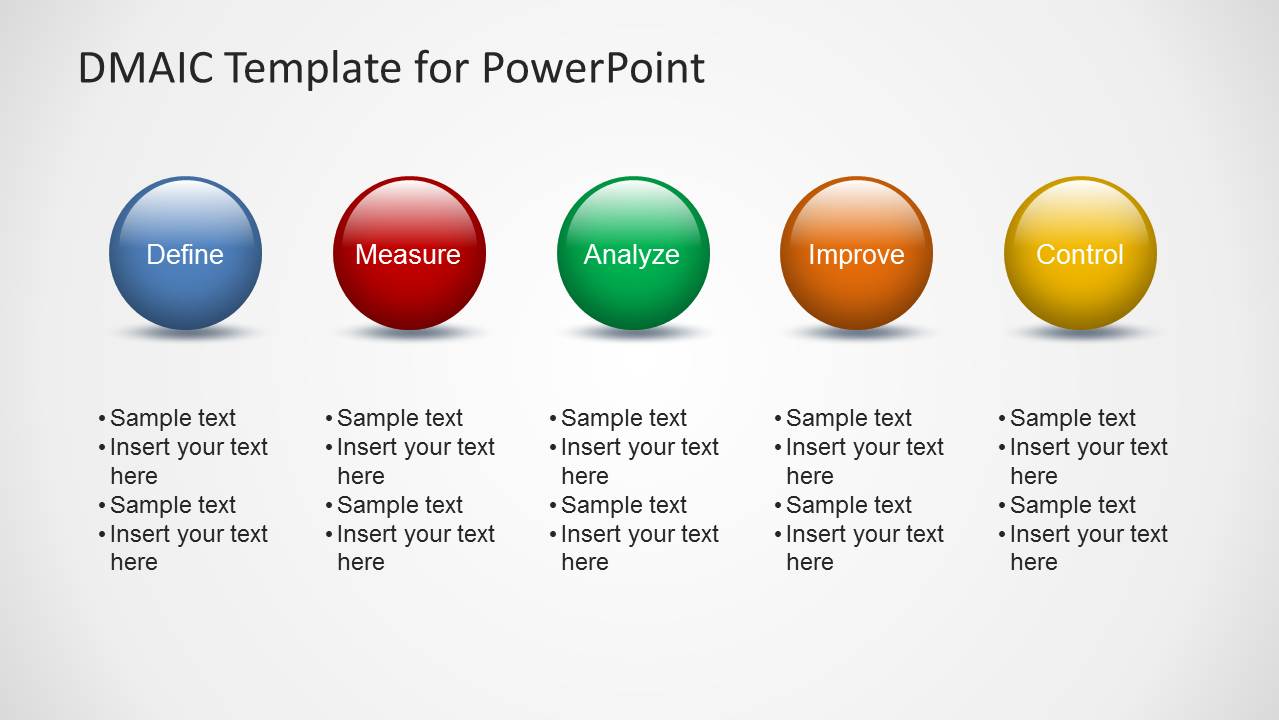
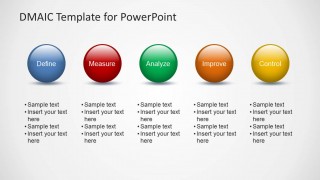
- A quality team trainer can teach the DMAIC method by presenting the horizontal sphere process row and adding concise bullet points under each phase.
- A process consultant can compare client workstreams by adapting the column layout to list actions, evidence, and next decisions for Define, Measure, Analyze, Improve, and Control.
Features
- 100% editable presentation template
- Compatible with Microsoft PowerPoint and Google Slides
- 16:9 aspect ratio slides
- Scalable vector shapes, icons and illustrations
- AI-Ready for Microsoft Copilot and Claude
- Instant access and download
Frequently asked questions
Q: How should a presenter communicate the DMAIC message with these slides?
A: Start with the full five-step view so the audience understands the method before discussing details. Use the step block or sphere overview to define the sequence, then move to a column layout when you need to list tasks, evidence, or decisions. Keep each phase to a few bullets so the process remains clear.
Q: Who is this template best suited for in a process improvement presentation?
A: It is best for Lean Six Sigma teams, operations managers, quality leaders, and consultants who need to explain a structured improvement method. The template works well when the audience needs to see how Define, Measure, Analyze, Improve, and Control connect, not just hear a list of actions.
Q: Why do the colored phase blocks and circular icons help the explanation?
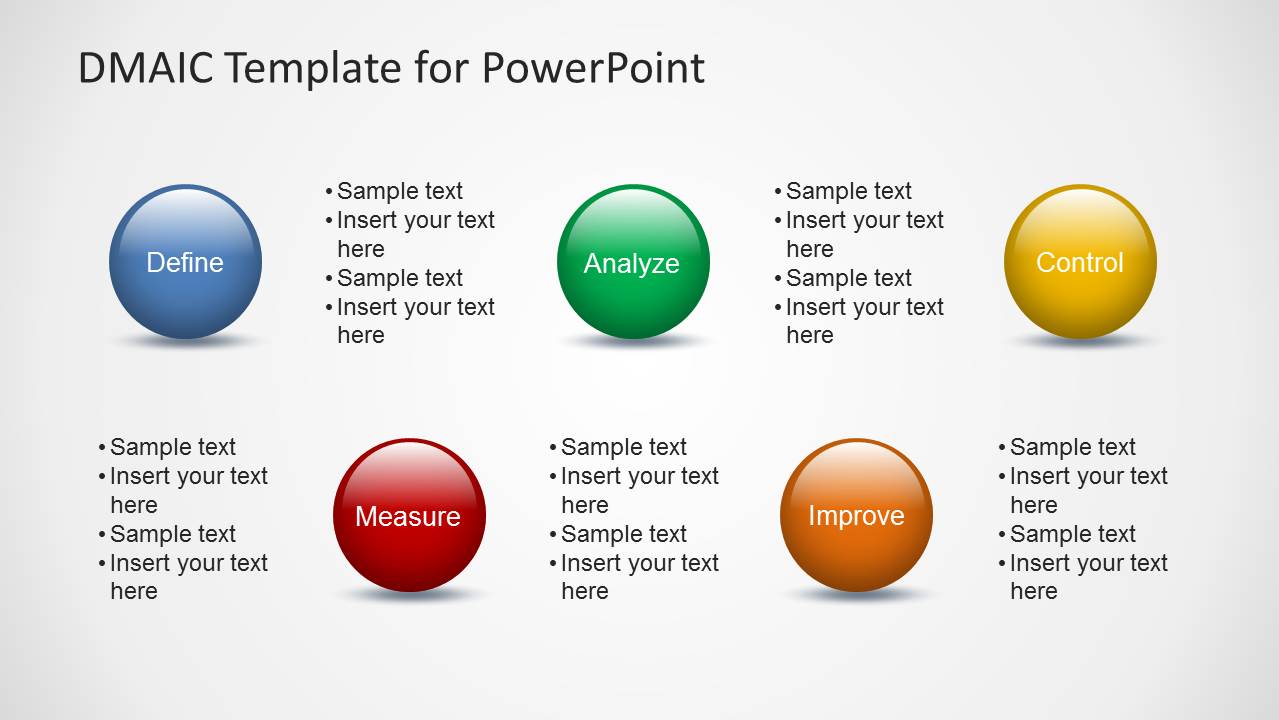
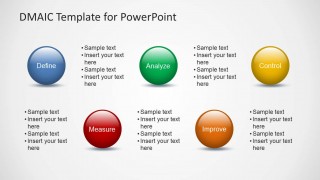
A: The color coding creates a quick visual distinction between the five DMAIC phases, while the repeated block and sphere shapes reinforce that each phase is part of one process. The circular icons act as milestones, and the column layouts turn the method into a working plan with space for phase-level notes.

DMAIC Template for PowerPoint
5-slide DMAIC presentation template with Lean Six Sigma process diagrams for PowerPoint and Google Slides
DMAIC Template for PowerPoint is a 5-slide process diagram deck for explaining Define, Measure, Analyze, Improve, and Control. It includes staggered step blocks, circular phase icons, horizontal sphere process rows, and five-column DMAIC layouts for Lean Six Sigma teams, consultants, and process improvement presenters using PowerPoint or Google Slides.
- Category
- Business PowerPoint Templates
- Rating


 Loading...
- Aspect ratio
- 16:9
- Item ID
- 6246-01
- Colors
 Microsoft PowerPoint
  Microsoft Copilot
  Claude for PowerPoint
 Other formats supported
Subscribe today and get immediate
access to download our PowerPoint templates.