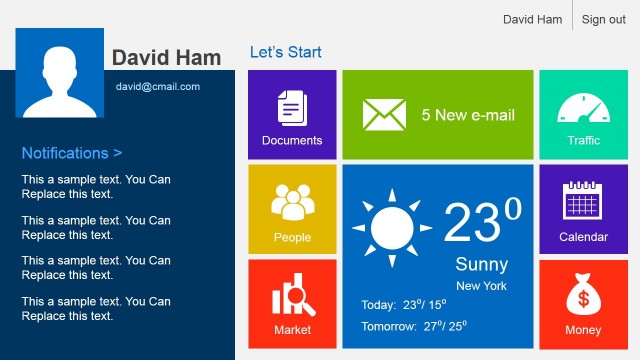
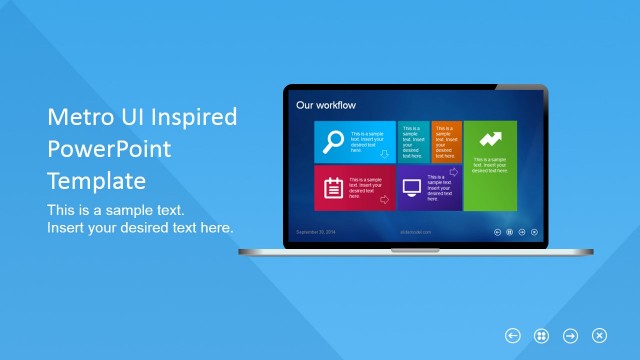
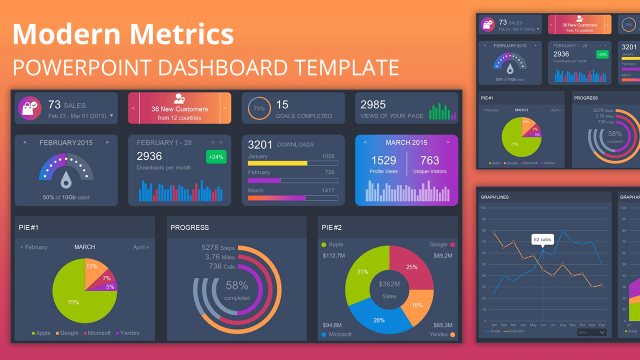
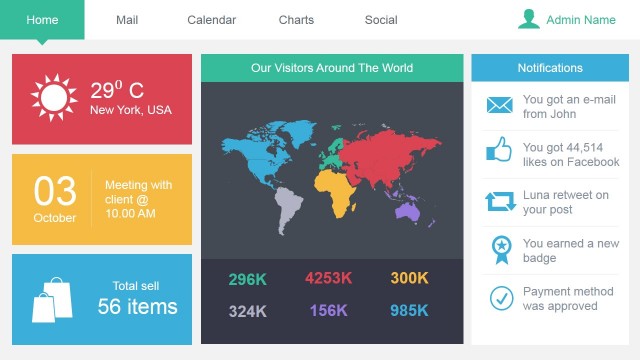
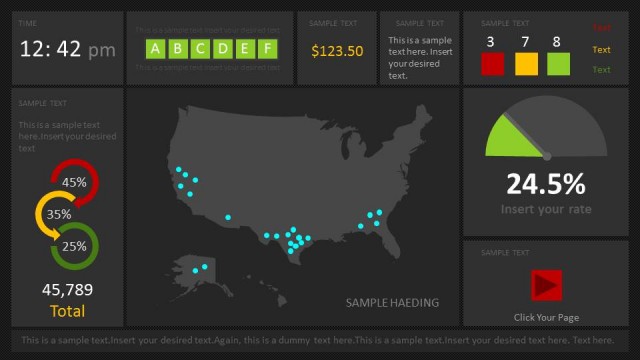
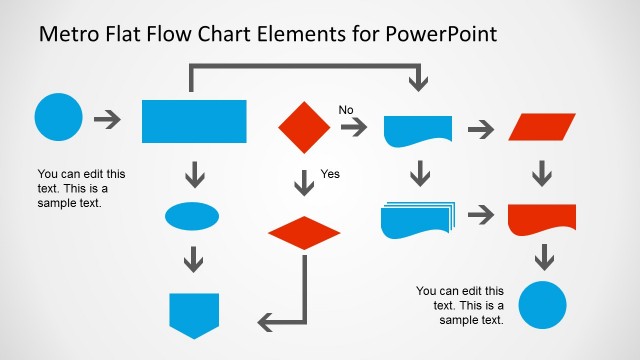
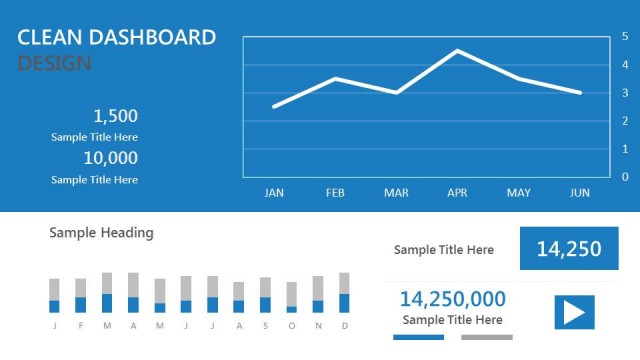
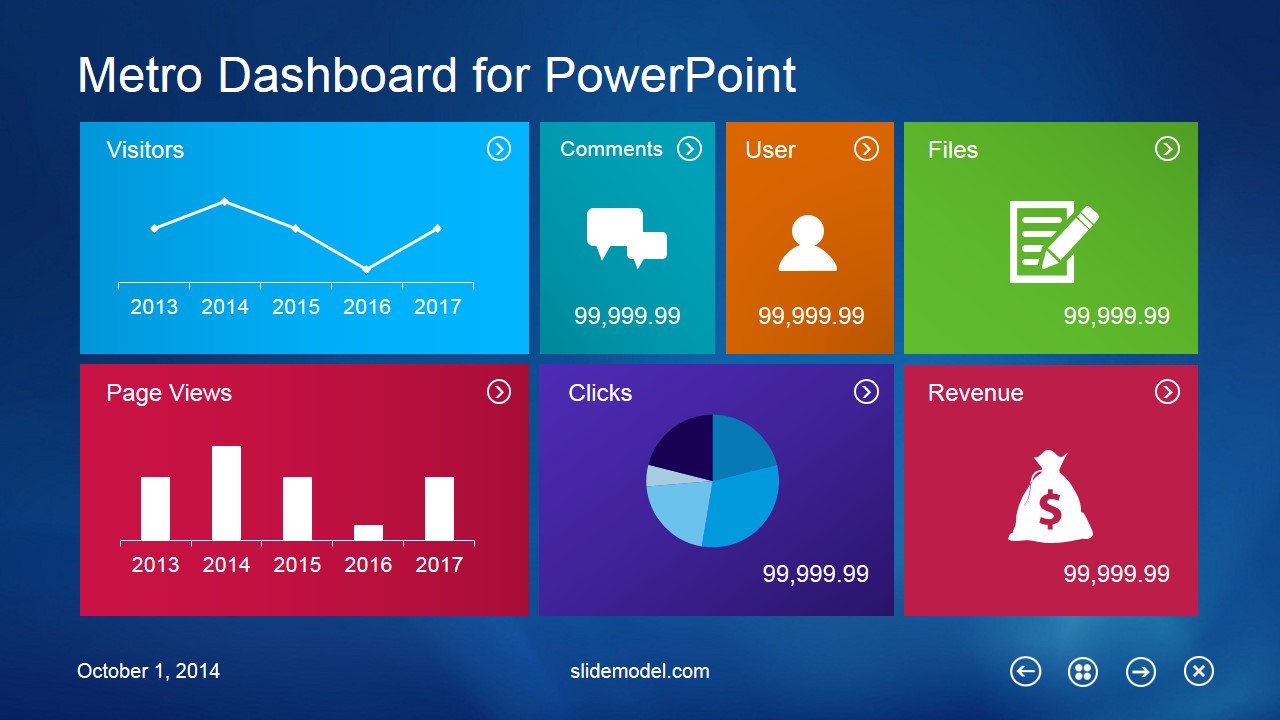
Metro Dashboard PowerPoint Template is a PowerPoint dashboard template inspired on Metro UI interface by Microsoft. Metro interface was introduced Microsoft 8 Operating System.
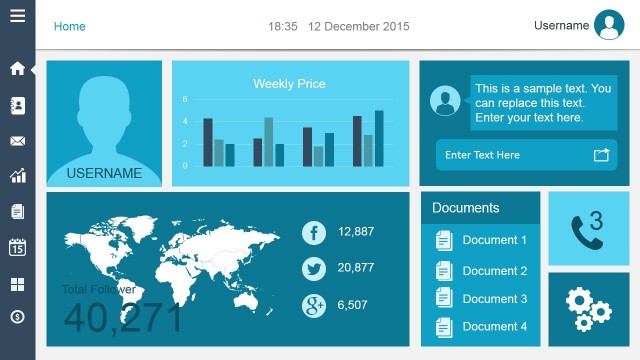
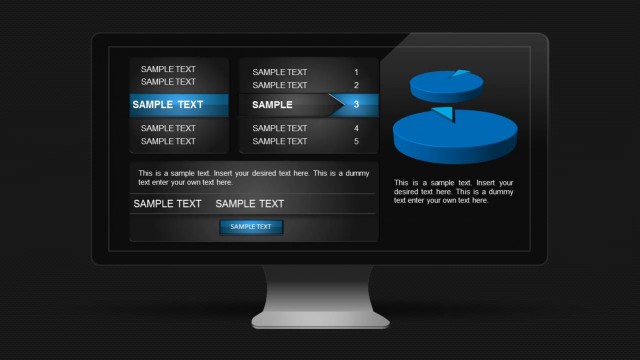
In this presentation dashboard template for Microsoft PowerPoint you can find useful slide designs for dashboard presentations including data-driven charts like pie chart and line chart that can be edited in Microsoft PowerPoint to present your data. Each slide has editable elements and graphics created as PowerPoint shapes.
Alternatively you can download other dashboard PPT presentations with attractive slide designs and editable shapes, like the digital marketing PowerPoint template dashboard.
What’s inside this template
Example presentation scenarios
- A product manager can use the KPI overview slide to brief leadership on traffic, users, comments, files, and revenue before moving into the individual metric slides.
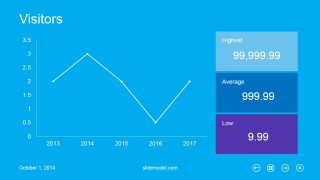
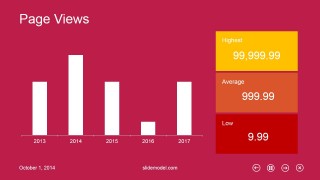
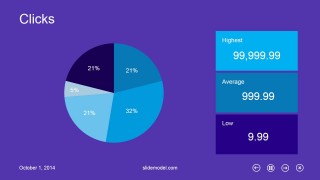
- A marketing analyst can use the visitors line chart, page views bar chart, and clicks pie chart to explain performance changes across several reporting periods.
- A UX lead can use the comments and user slides to discuss engagement signals and pair each large icon metric with qualitative observations in the text panels.
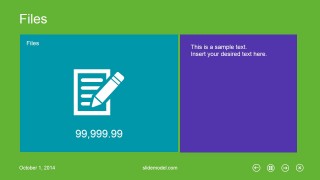
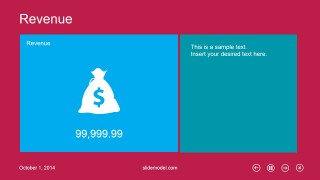
- An operations manager can use the files and revenue slides to connect activity counts with business impact during a monthly dashboard review.
Features
- 100% editable presentation template
- Compatible with Microsoft PowerPoint and Google Slides
- 16:9 aspect ratio slides
- Scalable vector shapes, icons and illustrations
- AI-Ready for Microsoft Copilot and Claude
- Instant access and download
Frequently asked questions
Q: How should the presenter guide the audience through this dashboard without overwhelming them?
A: Start with the overview tile slide to name the main metrics and establish what changed. Then move only into the detail slides that support the meeting goal, such as visitors, page views, or revenue. Use the highest, average, and low cards as talking points, not as a separate reading exercise.
Q: Who is this template best suited for in a business review?
A: This template fits presenters who need to report digital activity in a short meeting, such as product managers, UX leads, marketing analysts, or operations teams. The visible metrics around visitors, page views, clicks, comments, users, files, and revenue make it strongest for web, app, or service dashboards rather than broad corporate storytelling.
Q: Why does the Metro UI tile metaphor work for these metrics?
A: The tile layout makes each metric feel like a dashboard module with its own status area. That design helps the audience scan the overview quickly, then recognize the same color and metric family on the detailed slides. Large icons simplify category recognition, while charts carry the trend or distribution evidence.




Metro Dashboard PowerPoint Template
8-slide dashboard presentation template with Metro UI tiles, line chart, bar chart, and KPI panels
Metro Dashboard PowerPoint Template is an 8-slide, 16:9 dashboard presentation template with Metro UI tiles for web or product metrics. It includes a KPI overview, visitors line chart, page views bar chart, clicks pie chart, and icon-based comments, user, files, and revenue panels for analysts, UX teams, and business presenters in Microsoft PowerPoint and Google Slides.
- Category
- Business PowerPoint Templates
- Rating


 Loading...
- Aspect ratio
- 16:9
- Item ID
- 6632-01
- Colors
 Microsoft PowerPoint
  Microsoft Copilot
  Claude for PowerPoint
 Other formats supported
Subscribe today and get immediate
access to download our PowerPoint templates.