Modern Metrics PowerPoint Dashboard
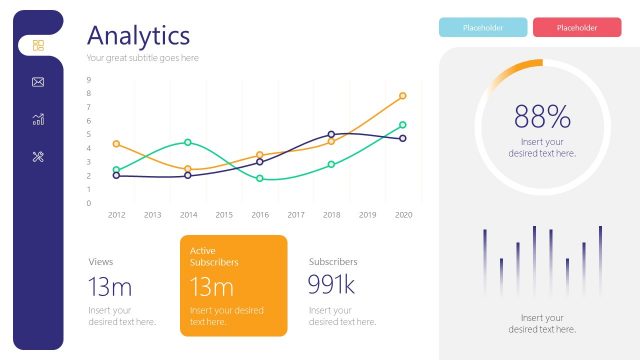
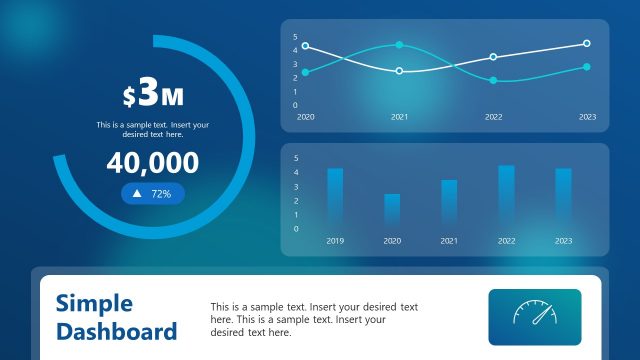
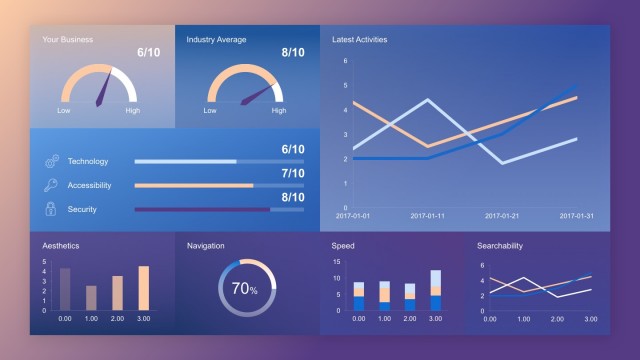
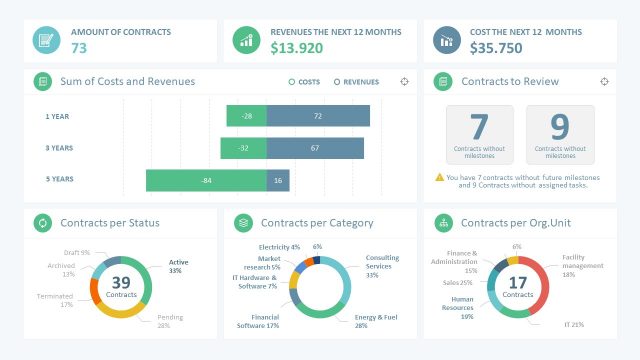
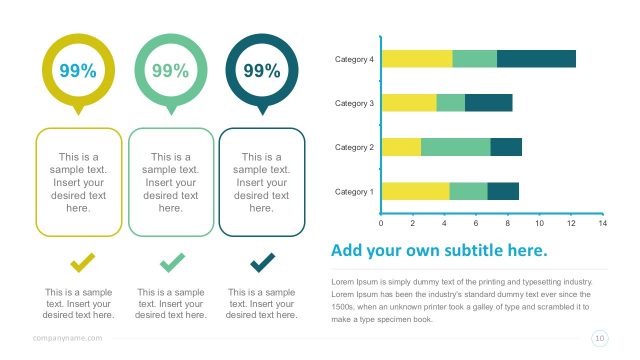
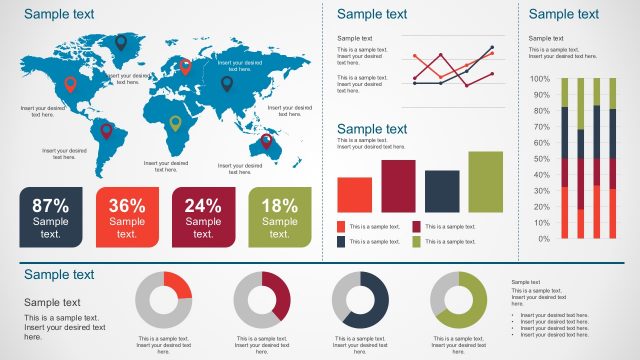
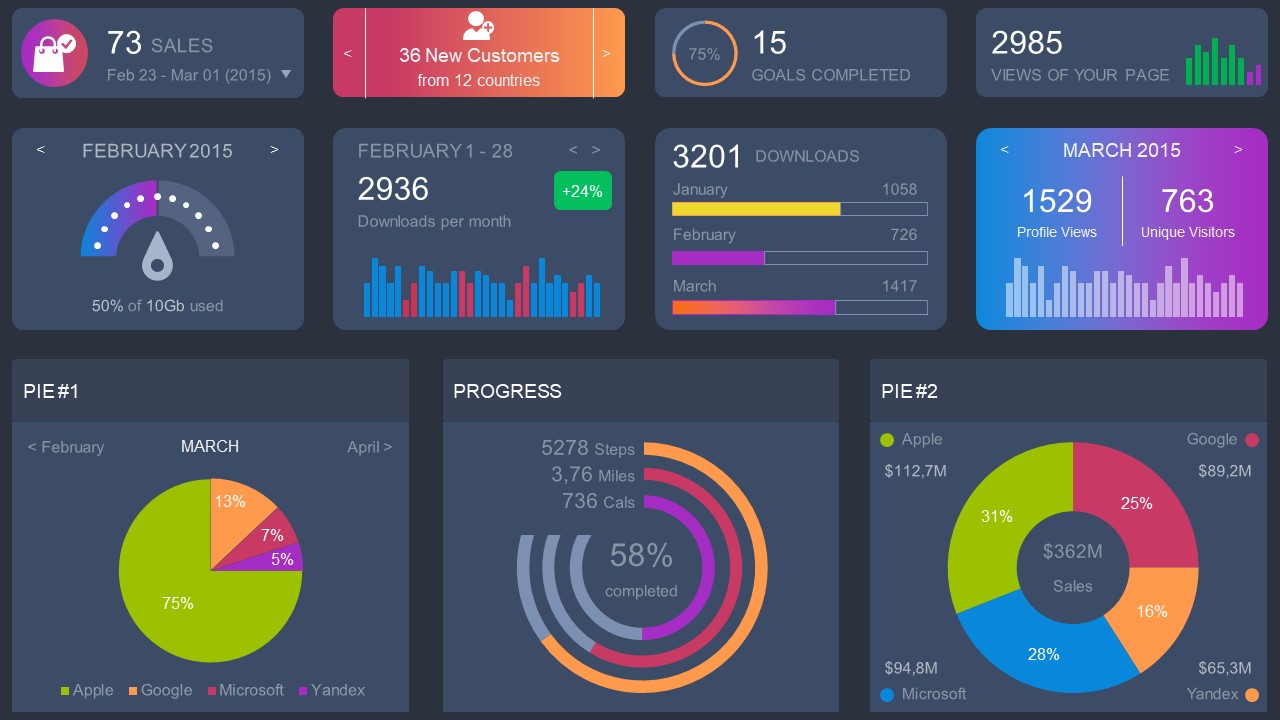
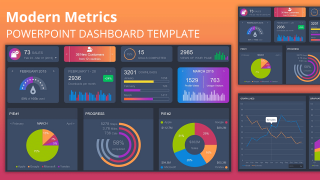
The Modern Metrics PowerPoint Dashboard provides several data drive charts and graphs. These data representation graphs are useful for various business analysis, research, and statistical reports. Several daily, weekly, or annual progress reports in single slide view are known as dashboard templates. Because these illustrate the real-time project management and sales software dashboards. But these modern charts can help in much more than just analysis or statistical reports. For example, copying the desired PowerPoint chart, shape or infographic for multiple data presentations. Like comparing products, timelines, predict future stability or track changes.
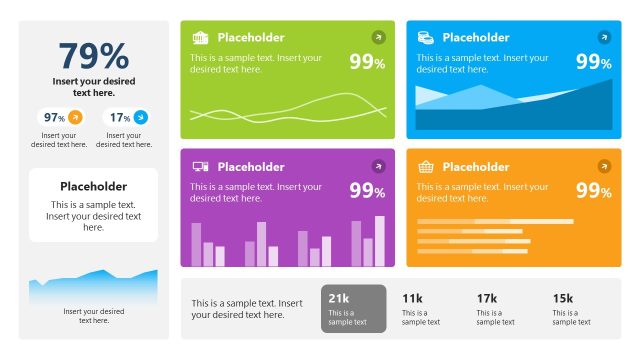
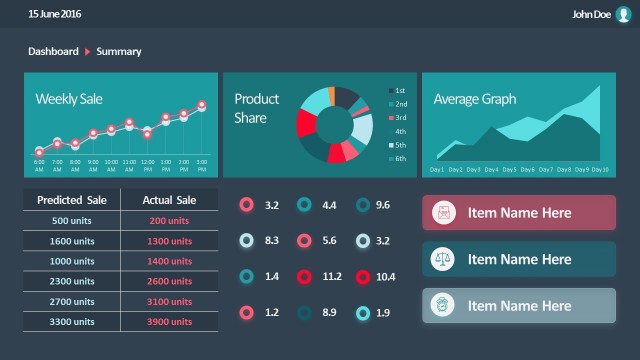
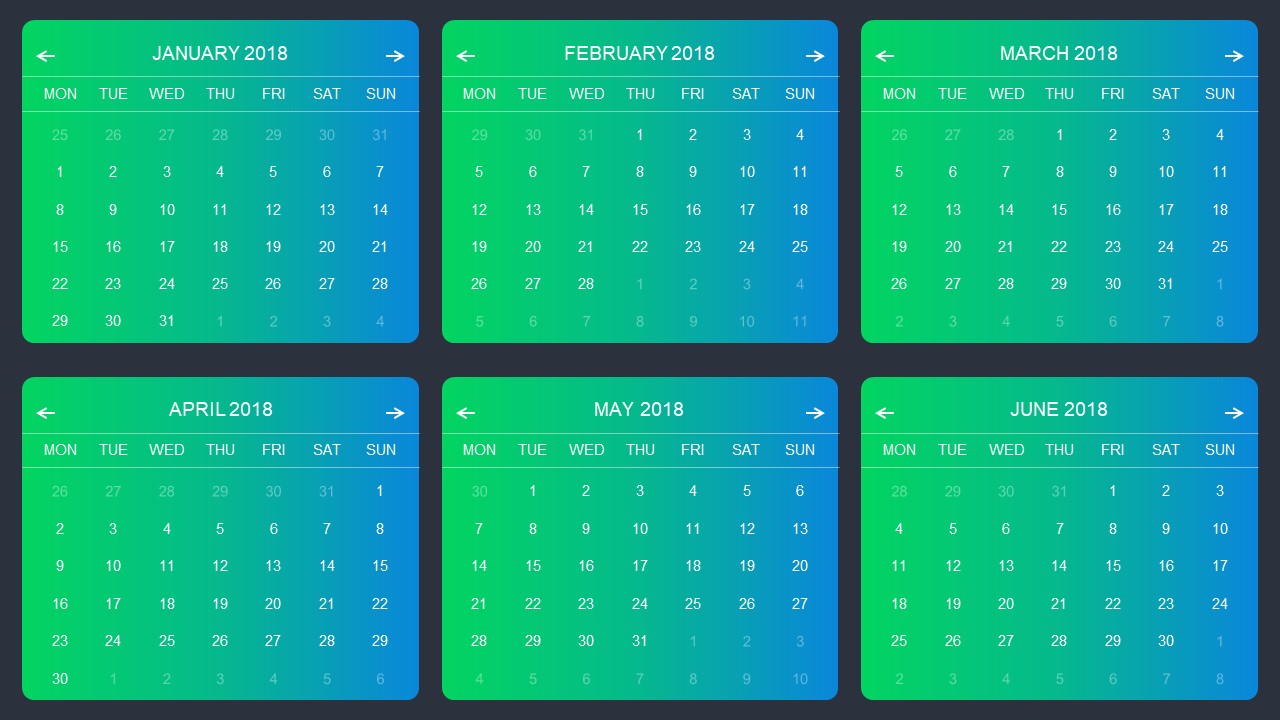
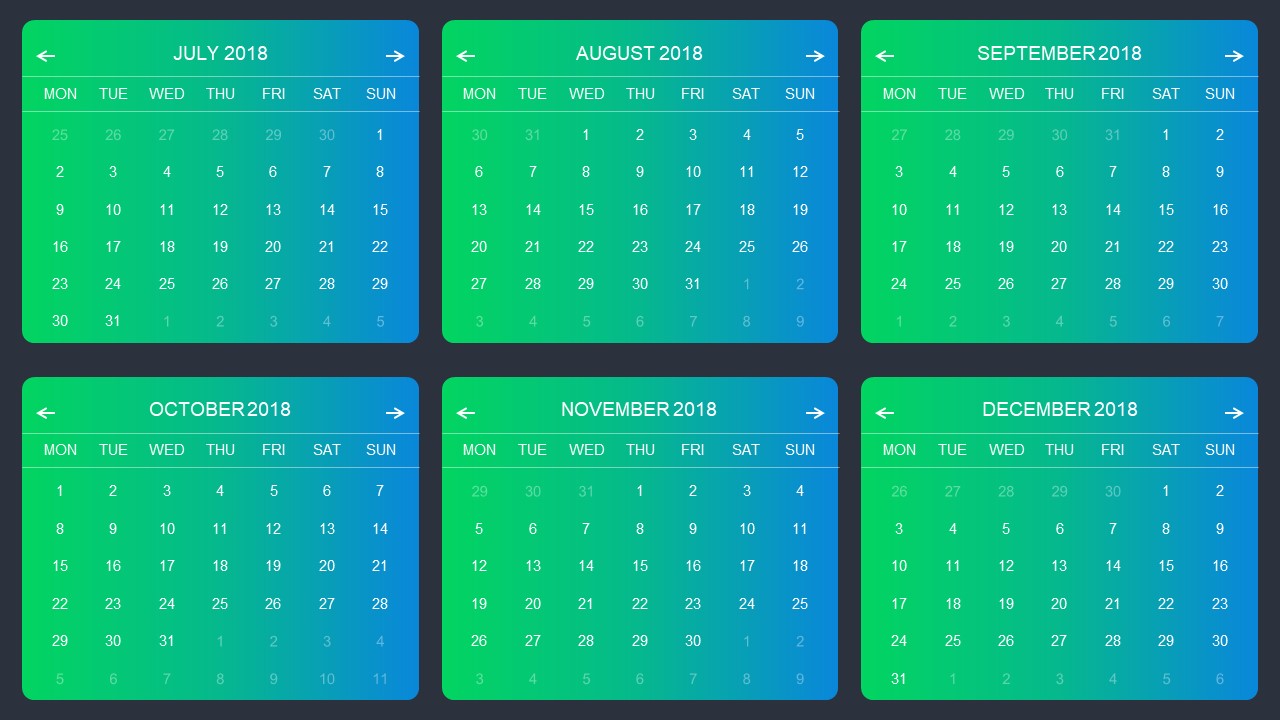
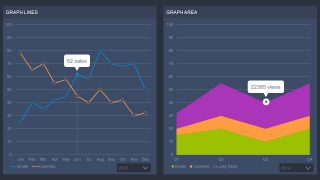
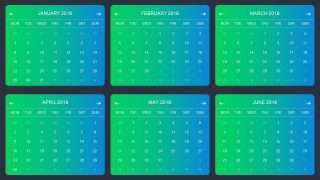
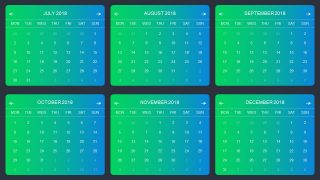
The Modern Metrics PowerPoint Dashboard enables audience to assess essential information on single screen view. There are 5 slides of modern metrics where first three templates provide multiple data drive charts. These include pie, circular bars, multiple bars, sunburst, stacked, doughnut, line and area graphs. However, the last two slides contain 2018 calendar month-segments. Because the second slide shows February as a part of the dashboard. Apart from charts and graphs, the modern metrics template provides infographics to display several business elements. For instance, sales, customer, and stocks sections with clipart icons for visual illustration.
This modern metric dashboard template can link the data source to PowerPoint charts using excel spreadsheets. The advantage of using these data-driven charts is, information on PowerPoint will update automatically by any change in spreadsheet. When user selects a PowerPoint graph or chart, it shows plus, brush, and funnel shape appear on the left side. There are the editing buttons, enabling users to modify designs, alter elements i.e. number of bars, and insert data values. The infographic template can benefit professionals working with modern UI graphics. If you are looking for specific sales manager dashboard, financial saving, project management template and more.


You must be logged in to download this file.
DOWNLOAD- Category
- Data & Charts
- Rating


 Loading...
- Size
- 16x9
- Item ID
- 13036-01
- Colors
Subscribe today and get immediate
access to download our PowerPoint templates.