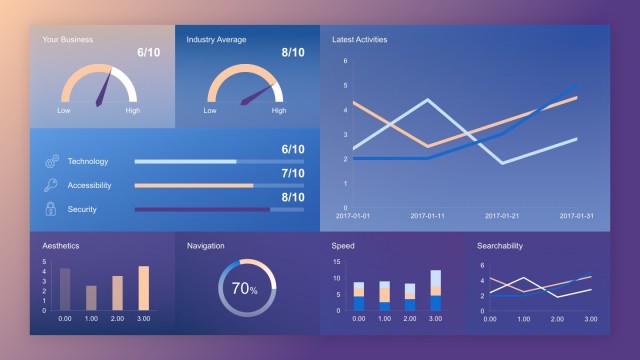
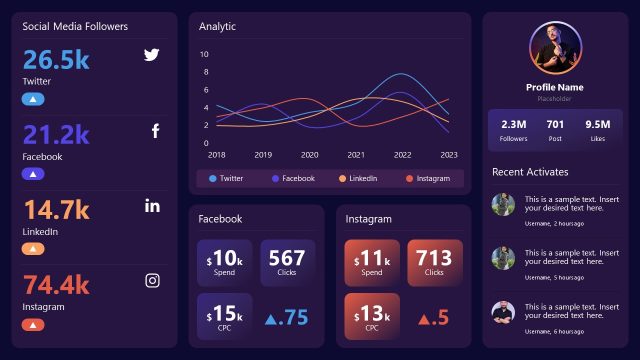
Digital Marketing Dashboard PowerPoint Template is a creative presentation designed for Digital Marketing Agencies. Its layout uses a modern flat design composed of widgets, distributed along the slides.
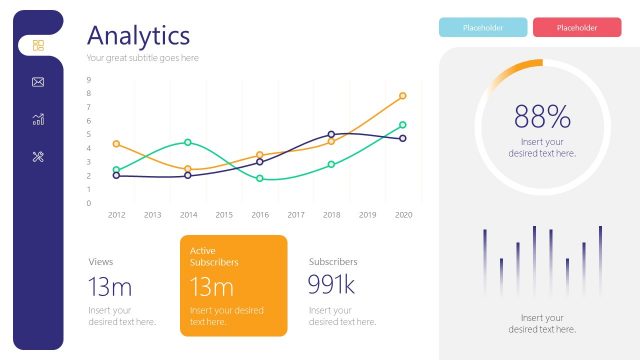
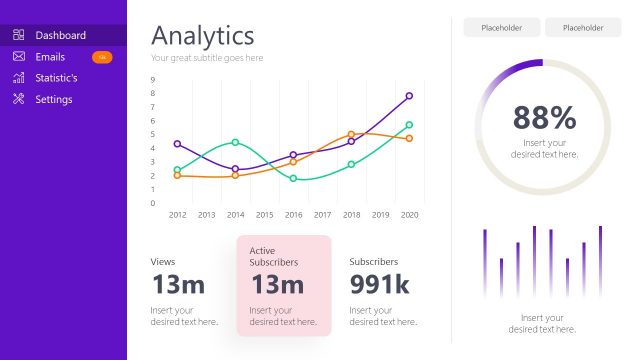
The widgets are displayed in horizontal layout. The top bar widgets contain information related to Digital Marketing jargon and KPI’s. The middle bar widgets contains Data-Driven Charts (Donut Charts and Line Charts) with information of browser usage and traffic vs conversion metrics. The bottom widget bar contains the most popular social networks metrics.
Every widget and shape is created as a PowerPoint object, providing complete flexibility, awesome quality when resizing and of course fully editable properties as color, shapes and effects.
The digital marketing dashboard PowerPoint template manages information of social networks marketing, online and search campaigns information, and of course traffic usage information. The user can combine this modern dashboard with additional KPI’s indicators from our Gauges & Meters Templates , Charts from our PowerPoint Data & Charts Templates or Funnel Diagrams from our Marketing Templates.
Impress your audience and compile your digital marketing information in this modern dashboard.
What’s inside this template
Example presentation scenarios
- A marketing agency account manager can use the KPI cards and campaign data table to summarize paid or social campaign performance for a client review.
- A digital marketing manager can use the browser donut charts and traffic line chart to explain website behavior, traffic patterns, and conversion trends to leadership.
- A social media manager can use the bottom social network tiles on the first dashboard to compare followers, contacts, feeds, and related channel metrics.
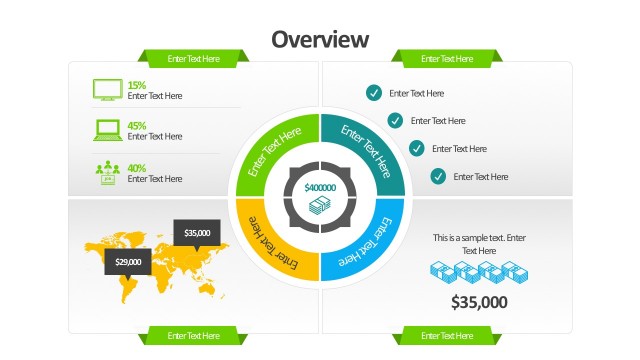
- A growth analyst can use the world map, country bars, and revenue gauges to connect audience geography with acquisition and financial indicators.
Features
- 100% editable presentation template
- Compatible with Microsoft PowerPoint and Google Slides
- 16:9 aspect ratio slides
- Scalable vector shapes, icons and illustrations
- Data-driven charts, editable in Microsoft Excel
- AI-Ready for Microsoft Copilot and Claude
- Instant access and download
Frequently asked questions
Q: How should a presenter explain the dashboard without overwhelming the audience?
A: Start with the top KPI cards on Slide 1 to give the audience a fast read on overall performance. Then move to the browser, traffic, and social widgets only if they explain a decision. On Slide 3, use the campaign chart and table together: the chart shows the pattern, while the table identifies which campaigns need action.
Q: Who is this template best suited for?
A: This template fits marketing teams, agency account leads, and growth analysts who need to report digital performance rather than build a full marketing strategy narrative. It works best when the audience expects metric snapshots, such as conversions, sessions, CTR, traffic, revenue, and social channel indicators, in a short update or review meeting.
Q: Why does the widget dashboard format work for digital marketing reporting?
A: The widget format mirrors how marketing teams monitor live performance: separate tiles for traffic, browser mix, geography, campaign data, revenue, and social activity. This helps viewers scan for exceptions before discussing causes. The colored KPI cards and gauge metaphors also create quick visual anchors for progress, status, and priority.


Digital Marketing Dashboard PowerPoint Template
3-slide digital marketing dashboard presentation template with KPI widgets, campaign metrics, and traffic charts
Digital Marketing Dashboard PowerPoint Template is a 3-slide data-driven dashboard deck for marketing reporting in Microsoft PowerPoint and Google Slides. It includes KPI cards, browser donut charts, traffic line charts, a world map, revenue gauges, and campaign performance tables. Chart data can be edited as an Excel spreadsheet in PowerPoint.
- Category
- Marketing
- Rating


 Loading...
- Aspect ratio
- 16:9, 4:3
- Item ID
- 8117-01
- Colors
 Microsoft PowerPoint
 Microsoft Copilot
 Claude for PowerPoint
Other formats supported
Subscribe today and get immediate
access to download our PowerPoint templates.